TrendLab Fusion: What 10,328 Trades Taught Me About Grid EAs
Saturday, 4 July 2026
This one is different from my usual daily log. Instead of a fresh result, I built TrendLab Fusion v1.1 by going back through 10,328 real closed trades from two of my grid EAs — including the exact ladders that blew an account — to find out precisely what worked, what killed the accounts, and how to fix it. This is part 1: the forensic findings and the redesign. Part 2 will publish the stress-test results once they’ve actually run — not projections, real replays.
✅ What this is: A forensic post-mortem built on two real RoboForex accounts and 10,328 closed trades. No demo cherry-picking, no hypotheticals — including one account that grew to nearly +$9,500 realized and then blew up. I’m showing you the autopsy, because the lessons are worth more than any single win.
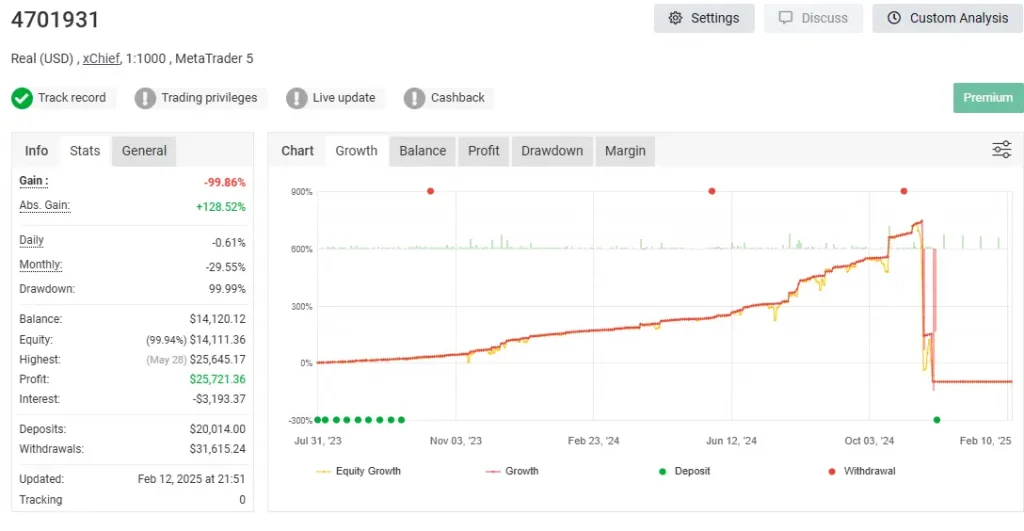
One of my real accounts running the two grid EAs: a steady climb to over +$25,000 profit at the peak (May 2024)… then −99.86% when a deep ladder ran away. This is the exact ‘months of profit gone in hours’ pattern the forensics explain — and the reason TrendLab Fusion caps basket depth. This is a separate real account (xChief) showing the same pattern.
Why I built this: years of real accounts, real profit, and real pain
This didn’t start as a coding project. For several years I ran two EAs on real cent accounts, and the honest truth is mixed: I did make money — repeatedly, over months. But I also blew accounts. And nothing in trading has frustrated me more than watching several months of hard-won profit disappear in a matter of hours when one grid ladder ran away. You grind for weeks, the curve climbs, and then a single bad run against a strong trend erases all of it before you can react.
That specific pain — profit built slowly, destroyed instantly — is what made me want to build my own EA: one that fuses the part that genuinely worked in both systems while forbidding the part that kept wiping the account. That’s the whole idea behind TrendLab Fusion — take the best of two worlds, and cap the worst. The forensics below are me finally sitting down with years of my own real trades to prove, with data, exactly where the money was made and exactly where it was lost.
The two accounts, honestly
Golden Lab (Jan 2025 – Jul 2026): 6,179 trades, +$9,467 realized — then the account was blown down to about $200 by a GBPAUD buy ladder that reached 8.81 lots.
So these strategies made real money over thousands of trades — and one still destroyed itself. That contradiction is exactly what the forensics had to explain.
TrendLab Fusion: what the 10,328 trades revealed
When I broke every basket down by depth — how many averaging levels deep it went — the picture was stark and consistent:
Basket depth
Result
Win rate
Depth 1–5 (shallow)
≈ +$17,600 combined
93–100%
Depth 8+ (deep)
≈ −$7,400
caused every disaster
The shallow baskets were the entire edge. The deep baskets — the “recovery” ladders — erased profits and blew the account. Same EA, two completely different behaviours depending on depth.
This is the single most important thing I’ve learned from any of my EAs: the grid wasn’t broken — the depth was. Shallow baskets won almost every time. It was the deep recovery ladders, piling in to rescue a losing position, that caused 100% of the damage.
The four disasters, named
Four events caused the bulk of the pain, and every one was a deep ladder against a strong trend:
GBPAUD — Jan 28, 2026: −$3,243 on a single ladder
AUDUSD — Jan 22, 2026: −$2,410
AUDNZD — Nov 13, 2025: −$2,332
GBPAUD — Jul 1–2, 2026: the final blowup, ladder to 8.81 lots
Which pairs actually worked
Broken down by symbol across both EAs, the honest scorecard:
Profitable: EURUSD +$8,172 (won in both EAs), GBPAUD +$4,357, GBPUSD +$2,862, CHFJPY +$2,637
Losers: EURCAD −$126, AUDUSD −$28, AUDNZD −$1,202
Note the nuance: GBPAUD was net profitable overall (+$4,357) yet also caused the two worst disasters. That’s the grid paradox — a pair can pay you for months and still be the one that kills you on a deep ladder.
The fix: TrendLab Fusion v1.1
The redesign keeps the DNA that actually worked (the shallow-basket edge) and puts hard limits on the part that did the damage. Same core — 200-point grid, 1.2× dynamic spacing, Kmartin 1.5, M15 signals — plus four new guardrails:
Depth cap at 6 — no more depth-8+ ladders, the ones responsible for every disaster.
H4 EMA/ATR trend gate on adds beyond depth 3 — it won’t keep piling into a position that’s fighting a strong higher-timeframe trend.
Hard basket stop at 3% of equity — a single basket can’t run away.
Global equity brake at 12% — an account-level circuit breaker.
The honest part: what I am NOT claiming
Here’s where I have to be straight, because this is exactly the point where a hype seller would show you a beautiful projected equity curve. I’m not going to. These fixes don’t turn losing trades into winners — that’s not what they do. What they’re designed to do is turn a −$3,243 runaway ladder into roughly a −$200 stopped basket. They cap the disaster, they don’t erase the loss.
And critically: I haven’t run the stress tests yet. The plan is to replay all four historical disasters through v1.1 and measure exactly what the new guardrails would have done. Until those replays actually run, any number I gave you would be a projection — and projections are precisely what got these accounts blown in the first place. So part 2 of this post will publish the real replay results when they’re done. Real numbers, or nothing.
Verdict on part 1
The forensics are clear: the edge was real and lived in shallow baskets; the disasters were real and lived in deep recovery ladders. TrendLab Fusion v1.1 is built to keep the first and forbid the second. Whether it actually survives the four disasters that killed its predecessors is the question part 2 will answer — with replay data, not promises.
Important: This post analyses historical results from real accounts, one of which was blown. Not financial advice. Grid and martingale-style strategies carry a very high risk of total account loss — the account histories here prove it. Nothing here is a projection of future performance. Past results do not predict future outcomes. These are my own results and opinions. Never trade money you can’t afford to lose.