Fixing the recovery Ladder: A Two-Second Losing Trade Told Me Everything
One of my losing trades lasted two seconds. It opened at 15:30:00, closed at 15:30:02, and lost $7.60 — the single biggest loss in the whole account, gone in the time it takes to read this sentence. That trade wasn’t bad luck. It was a bug, hiding in one line of code, and it took me 407 trades to find it. This is the recovery ladder autopsy.
The root cause, in one sentence: The recovery ladder was supposed to increase risk to recover losses. Instead it moved the target further away and dragged the stop closer, until the stop was sitting inside the market’s noise. It wasn’t recovering losses — it was manufacturing them.
✅ Read this first: These numbers come from a real RoboForex demo account (standard USD, not cent), running BTC ATM Machine v5 across five weeks and 407 trades. It lost money — I’m showing you exactly why, unedited. This is part one: the autopsy. The rebuilt EA it led to has not traded a single live trade yet, and I make no claim that it works. Part two will publish those results, whatever they are.
The numbers — losses included, nothing hidden
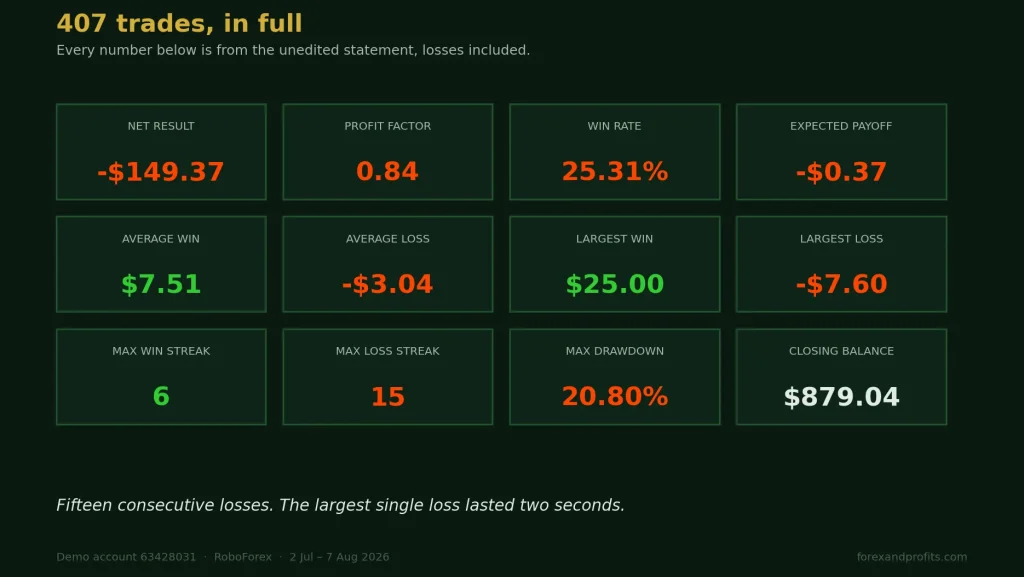
- Total net profit: −$149.37 over 407 trades (2 July – 7 August)
- Profit factor 0.84 — gross profit $773.46 against gross loss $922.83
- Win rate 25.31% — 103 wins, 304 losses
- Max drawdown 20.80% ($225.14)
- Max consecutive losses: 15 in a row
- Closing balance $879.04, from a $1,000 demo start
The counterintuitive part: it was almost break-even
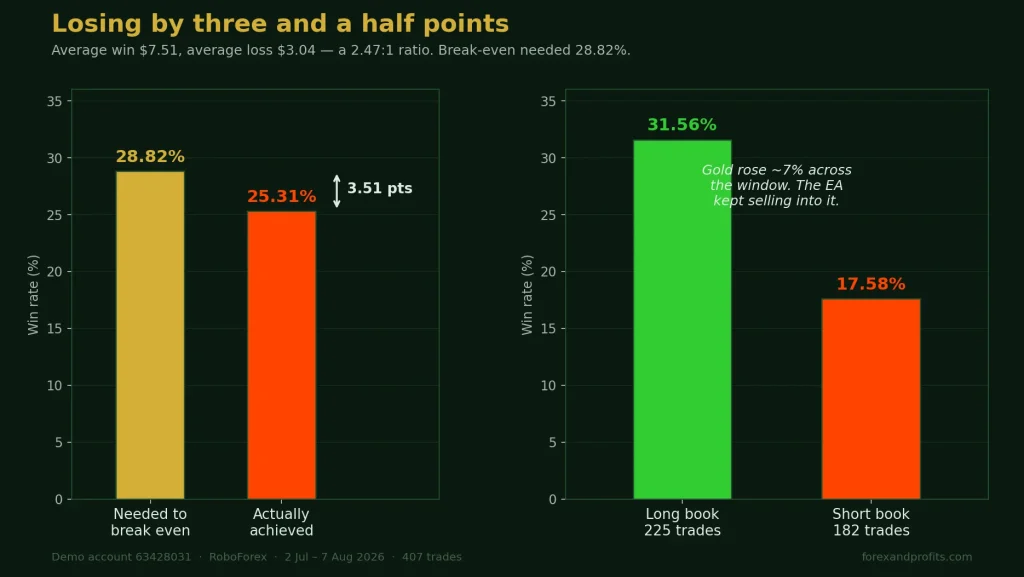
Here’s what surprised me when I did the arithmetic. The average win was $7.51 and the average loss just $3.04 — a reward-to-risk ratio of about 2.47 to 1. With that ratio, the win rate needed just to break even is:
3.04 ÷ (7.51 + 3.04) = 28.82%
The EA achieved 25.31%. So it wasn’t a catastrophe — it was losing by just 3.51 percentage points. This wasn’t a terrible strategy that needed scrapping. It was a nearly-break-even strategy with one broken component. That reframed everything: the job wasn’t “start over,” it was “find the 3.5 points.”
The recovery ladder bug: a stop that shrank as the bet grew
Two numbers governed every trade, and they were set up in opposite ways.
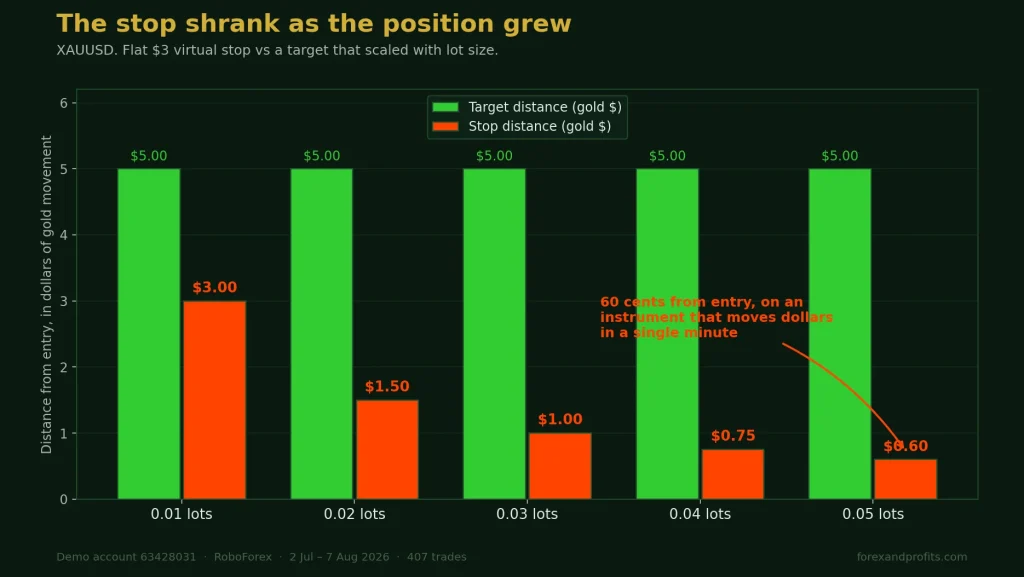
The take-profit scaled with lot size. At 0.01 lots the target was $5; at 0.05 lots it was $25. Because the dollar target and the position size grew together, the target distance in price stayed constant — about $5 of gold movement every time.
The stop-loss did not scale. It was a flat $3 of risk regardless of position size. So as the recovery ladder increased the lot, the stop distance shrank. Here’s the arithmetic on gold, where a $1 move equals $100 per lot:
| Recovery level | Lot | Stop distance | Target distance |
|---|---|---|---|
| 1 | 0.01 | $3.00 of gold movement | $5.00 |
| 2 | 0.02 | $1.50 | $5.00 |
| 3 | 0.03 | $1.00 | $5.00 |
| 4 | 0.04 | $0.75 | $5.00 |
| 5 | 0.05 | $0.60 | $5.00 |
By recovery level 5, the stop sat 60 cents away from entry — on gold, which routinely moves several dollars in a minute. The stop was inside the noise. The trade couldn’t survive long enough to reach a target eight times further away.
The receipts: trades that died in one second
These are real ticket numbers from the statement. Look at the open and close times — one to two seconds apart:
| Ticket | Symbol | Lot | Open → Close | Result |
|---|---|---|---|---|
| 969268470 | XAUUSD | 0.02 | 16:00:02 → 16:00:03 | −$2.78 |
| 969288518 | XAUUSD | 0.03 | 16:15:00 → 16:15:01 | −$3.84 |
| 963345322 | XAUUSD | 0.04 | 03:45:00 → 03:45:01 | −$4.28 |
| 961121692 | XAUUSD | 0.04 | 09:00:00 → 09:00:02 | −$5.64 |
| 969223361 | XAUUSD | 0.05 | 15:30:00 → 15:30:02 | −$7.60 |
The bigger the lot, the faster the death and the bigger the loss. That last one — two seconds, −$7.60 — is the largest single loss in the entire account.
And note something important: that −$7.60 is more than double the $3.00 the stop was supposed to cap. On larger lots, price moved through the threshold between ticks before the EA could react. This is the hidden weakness of a virtual stop — one the EA enforces itself by checking each tick, rather than a real order sitting on the broker’s server. A virtual stop can only act when it sees a tick; fast markets move between ticks, and the promised cap fails exactly when you need it most.
The second finding: it kept shorting a rising market
Gold trended up about 7% across the five weeks of the test. Yet the EA kept selling into it. The proof is in the direction split:
- Long positions: 225 trades, 31.56% win rate
- Short positions: 182 trades, 17.58% win rate
Nearly a 14-point gap between the two sides of the same book. The EA had a higher-timeframe filter available, but it only blocked a trade when the higher timeframe actively disagreed — a flat or indecisive reading let everything through. Combined with an entry trigger tuned for mean-reversion, it repeatedly sold into a sustained uptrend. This matches a pattern I’ve now seen across many of my accounts: counter-trend entries meeting a sustained trend are the primary blow-up mechanism — not the core strategy failing.
The third finding: the wrong tool for the job
The EA’s entry signal was a Stochastic oscillator — but configured with a 34-period %K, 10-period slowing and smoothed averaging, it was so heavily filtered it behaved like a lagging trend indicator. It was then used to trigger mean-reversion entries (buy the dip, sell the rally). That’s a tool/purpose mismatch: a slow trend proxy asked to time reversals will systematically enter late, in the direction that’s already exhausted.
Three more structural bugs, briefly
The stop/target inversion was the killer, but the autopsy turned up three more — worth listing because they show the diagnosis was thorough, not one lucky catch:
- One shared recovery counter across five symbols. A loss on EURUSD escalated the lot size of the next BTCUSD trade. Five unrelated instruments compounded each other’s losses into position sizes nobody chose.
- Lots normalised against the wrong symbol. The code used the chart’s symbol, not the traded symbol, so every position was sized against one chart’s rules regardless of what was actually being traded.
- The current target applied retroactively to old trades. A trade opened with a $5 target could be held to $25, or closed early, depending on unrelated activity on another symbol.
What this autopsy is — and isn’t
An honest boundary: everything above is well-evidenced — it comes from 407 real trades and the actual source code. But the diagnosis is in-sample: every finding was derived from the same trades it explains. That makes the root cause solid and any solution entirely unproven. Those are two different claims, and I won’t blur them.
I’ve rebuilt this EA from the ground up — the core fix inverts the whole logic, so the position size is now calculated from a volatility-based stop rather than the stop being bolted onto a chosen lot. That makes the 15-losses-in-a-row failure structurally impossible. But “structurally impossible to fail the old way” is not the same as “profitable.” Removing a known loss generator doesn’t create an edge — whether the strategy actually makes money is a separate, still-open question.
So this is part one: the autopsy. The rebuild has not traded a single live trade yet. I’ll publish part two — the real results — whether they’re good or bad. That’s the deal on this site: I show you the failures in full, and I don’t claim victory before the evidence exists.
Important: All results shown are from a demo account. Demo trading does not reflect real execution, slippage, or liquidity. Past performance does not indicate future results. Nothing here is financial advice. Automated trading carries substantial risk of loss, including total loss of capital. Trade only capital you can afford to lose.