Latest AUD/USD Update and Technical Analysis
Are you looking to master your AUD/USD forex trading plan? The AUD/USD currency pair has been buzzing with market activity, creating both challenges and opportunities for traders.
By analyzing its performance across monthly, weekly, daily, and 4-hour timeframes, we unlock crucial insights that can sharpen your decision-making. This post breaks down essential technical analysis, focusing on key levels like Fibonacci retracements and critical indicators such as RSI and Stochastic RSI. Get ready to trade smarter with actionable insights!
Monthly Chart Overview
The AUD/USD pair is currently making its way upward after bouncing from notable support levels. It nearly hit the 0.270 Fibonacci level before rebounding to the 0.236 level at 0.65309. Both the RSI and Stochastic RSI indicators are in the middle zone but trending upwards toward the sell zone. This momentum suggests that the pair could aim for the 0.618 Fibonacci level at 0.70935 in the near term.
For longer-term traders, this upward trajectory signals potential opportunities for medium to high-risk buy positions, with profits likely to materialize if the pair sustains its upward movement.
Key Monthly Chart Levels to Watch:
- Support: 0.270 Fibonacci level
- Resistance: 0.618 Fibonacci level at 0.70935
- Current Level: 0.236 Fibonacci level at 0.65309
Weekly Chart Analysis
On the weekly chart, AUD/USD shows a similar pattern of recovery. After dipping to the 0.270 Fibonacci level at 0.59079, the pair rebounded sharply to the 0.382 level at 0.64303. The RSI remains below the sell zone but is climbing steadily, while the Stochastic RSI is already in the sell zone, with its green and blue lines crossing. However, divergence between the RSI readings suggests caution, as the momentum could shift.
If the current upward momentum persists, this pair could target the 0.786 level at 0.67698. On the flip side, traders should remain prepared for a potential retracement back to the 0.270 level at 0.59166 if bearish momentum returns.
Key Weekly Chart Levels to Watch:
- Support: 0.270 Fibonacci level at 0.59166
- Resistance: 0.786 Fibonacci level at 0.67698
- Current Level: 0.382 Fibonacci level at 0.64303
Daily Chart Insights
The daily chart analysis reveals that the AUD/USD pair experienced a large upward movement, reaching the 0.000 Fibonacci level at 0.64374, where it has lingered for some time. The RSI remains below the sell zone but appears set to climb, suggesting that buyers may push the price higher. Meanwhile, the Stochastic RSI is already signaling a buying opportunity, with the green and blue lines recently crossing, pointing toward potential upward momentum.
This pair is anticipated to move to at least the 0.270 level at 0.65775, with a possibility of continuing its climb to the 1.618 Fibonacci level at 0.67680 for a longer-term target. These movements make it an attractive opportunity for traders looking to capitalize on upward trends in the short-to-medium term.
Key Daily Chart Levels to Watch:
- Support: 0.000 Fibonacci level at 0.64374
- Resistance: 1.618 Fibonacci level at 0.67680
- Short-Term Target: 0.270 Fibonacci level at 0.65775
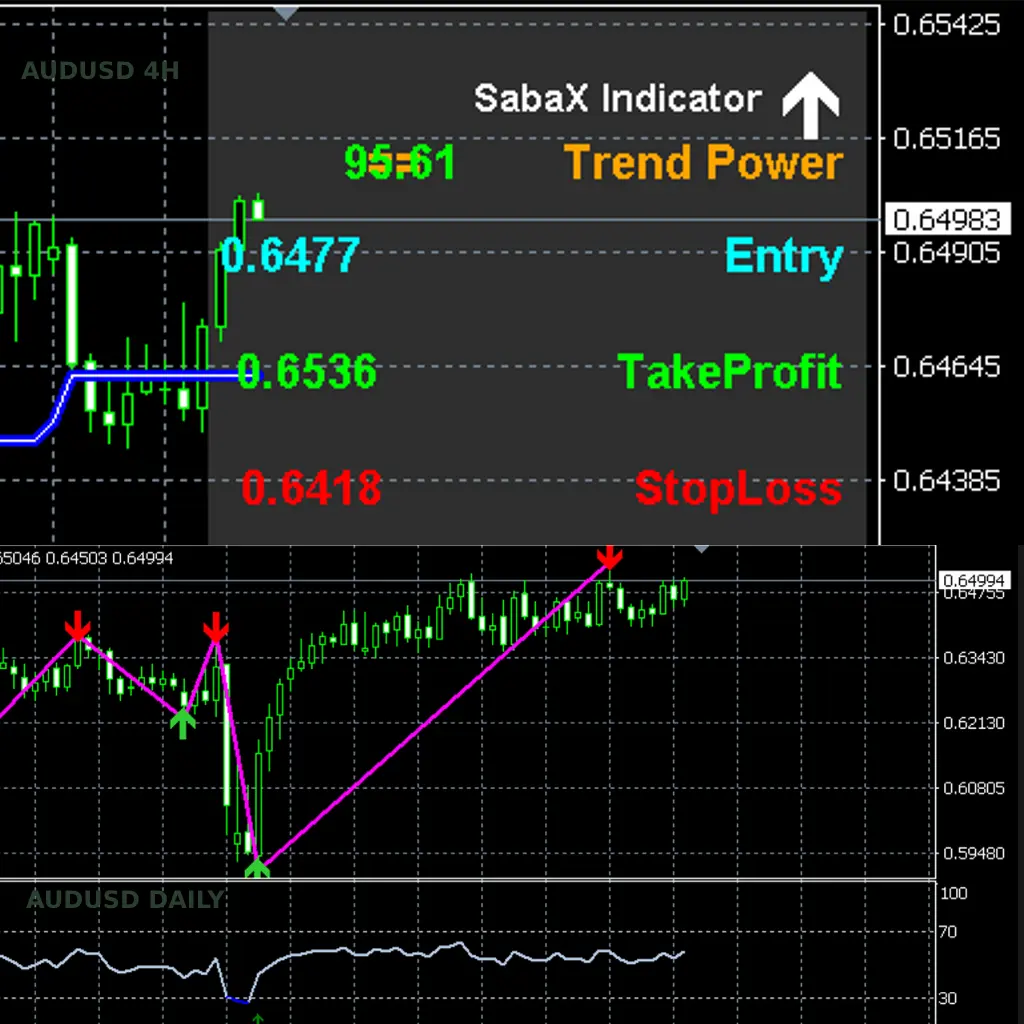
4-Hour Chart Update
The 4-hour chart provides insights into more immediate price action. The pair has been climbing steadily, recently touching the 0.000 Fibonacci level at 0.65024. The RSI is below the sell zone and has been hovering in this range, indicating a slow build-up of buying momentum. The Stochastic RSI is climbing toward the sell zone, but the green and blue lines have yet to cross, signaling that the pair has more room to rise before facing significant selling pressure.
Traders watching the 4-hour chart should keep an eye on the 0.270 Fibonacci level at 0.65295 as the next short-term target, with further upward movement likely taking the pair to the 1.618 Fibonacci level at 0.65623.
Key 4-Hour Chart Levels to Watch:
- Support: 0.000 Fibonacci level at 0.65024
- Resistance: 1.618 Fibonacci level at 0.65623
- Short-Term Target: 0.270 Fibonacci level at 0.65295
Actionable Insights for Traders
- Monitor Key Fibonacci Levels: Across all timeframes, Fibonacci retracements like 0.236, 0.382, and 0.618 are proving pivotal. Set entry and exit strategies around these levels for optimal risks and rewards.
- Pay Attention to RSI and Stochastic RSI: The momentum indicators suggest that the AUD/USD may have room to rise across most timeframes. Be cautious as the pair approaches the sell zone, particularly on higher timeframes.
- Adjust Positions Dynamically: On shorter timeframes such as the 4-hour chart, prepare for near-term resistance at 0.65295 and 0.65623. Consider taking partial profits at these levels and re-entering on pullbacks.
Final Thoughts
The AUD/USD pair is exhibiting strong indications of bullish momentum at multiple timeframes. With Fibonacci retracements and RSI indicators aligning, there are promising opportunities for traders to capitalize on upward trends. However, keep an eye on divergence signals and potential retracements at critical levels.
By staying disciplined and strategic, you can make the most of this robust market activity. Happy trading!

Trading Plan: AUD/USD (Set and Forget)
1. Current Market Overview
- The AUD/USD pair is showing signs of upward momentum across most timeframes.
- Key levels to watch are around 0.65775, 0.67698, and 0.70935 (potential targets for upward movement).
- Short-term dips might happen, but the overall trend leans bullish (upward).
2. Suggested Trades
- Buy Position 1: Enter at the current price (~0.65000).
- Take Profit (TP): 0.65775 (short-term target, ~77 pips gain).
- Buy Position 2: Enter at the current price (~0.65000).
- Take Profit (TP): 0.67698 (medium-term target, ~270 pips gain).
- Buy Position 3: Enter at the current price (~0.65000).
- Take Profit (TP): 0.70935 (long-term target, ~593 pips gain).
3. Why This Plan?
- The analysis suggests the pair is likely to climb higher, with strong resistance levels at the targets mentioned.
- By splitting your positions into three targets, you can lock in profits at different stages while riding the trend.
4. Expectations
- Short-Term (1-2 weeks): The pair could hit 0.65775 as it moves upward in the short term.
- Medium-Term (3-5 weeks): Momentum might push it to 0.67698, especially if the weekly divergence plays out.
- Long-Term (6-8 weeks): If the bullish trend continues, the pair could reach 0.70935.
5. Risk Management
- No stop-losses for this plan, but keep an eye on the market in case of unexpected news or events.
- Be patient—this is a “set and forget” strategy, so let the market do its thing.
Summary
Buy AUD/USD now (~0.65000) and aim for profits at 0.65775, 0.67698, and 0.70935 over the next 4-8 weeks. This plan is designed to capitalize on the upward momentum while keeping things simple and stress-free.
Big shoutout to our senior analyst Jackie for fearlessly wrestling with Fibonacci levels and crunching stats on every AUD/USD timeframe—we’re pretty sure they’ve seen more charts this week than cats see naps