Master the Market with this Actionable EUR/USD Trading Plan
The EUR/USD is taking the forex market by storm, and if you’ve been watching the charts, you know the excitement is real! With the European Central Bank (ECB) slashing rates yet again—dropping the Deposit Facility Rate to 2.5%—and the EUR/USD surging to a strong 1.0840, traders are jumping at the chance to capitalize on these bullish moves.
Now is the time to sharpen your EUR/USD trading strategy and ride this wave of market opportunity to higher potential profits.
Add to this the soft US employment data and tariff relaxations from President Trump, which have sent the US Dollar tumbling to its weakest point in months, and you’ve got the perfect storm for an exhilarating trading setup. Are you ready to take on the thrilling momentum of the forex market? Let’s dive into the details!
When it comes to forex trading, the EUR/USD currency pair is one of the most popular and heavily traded pairs. This is because it represents two of the world’s largest economies – the European Union and the United States. Many traders are interested in developing a profitable EUR/USD trading strategy as it can offer significant profit potential.
Before we dive into specific strategies, let’s first understand some background information about this currency pair. The EUR/USD is known as a “major” pair in forex trading, meaning that it involves two of the world’s most widely used currencies. As such, it tends to have high liquidity and tight spreads.
The EUR/USD pair is making waves in the market, presenting incredible opportunities for traders ready to pounce.
With clear signals emerging on the monthly, weekly, and daily charts, it’s time to sharpen your strategy and take advantage of what could be a great trading setup. This post will break down key market insights, actionable strategies, and risk management tips to guide your trading decisions.
Why This EUR/USD Trading Setup Is Exciting
The EUR/USD pair is currently responding to major trendlines and Fibonacci retracement levels across multiple timeframes. The alignment of indicators like RSI and stochastic RSI adds another layer of precision, offering potential trade entries for both short-term and swing traders.
Here’s what you’ll learn in this post:
- The key Fibonacci levels to monitor on monthly, weekly, and daily charts.
- How RSI and stochastic RSI provide reliable signals for entry and exit points.
- Actionable trading strategies with clear stop-loss and target zones.
What the Charts Are Saying
Monthly Chart Overview
| Key Level | Indicator Insights | Suggested Strategy |
|---|---|---|
| Downtrend line at 1.08335 | RSI moving up toward the sell zone; stochastic RSI in the buy zone with lines nearing a crossover. | Look for a breakout above 1.08335. Target 1.16691 (0.786 level). Use RSI to confirm breakout strength. |
Insights:
- A break above the downtrend line signals a potential bullish run to 1.16691.
- Stochastic RSI nearing a crossover backs up this potential upward move.
Takeaway:
Wait for confirmation of a breakout. Enter long trades once 1.08335 is cleared, and keep an eye on RSI approaching overbought zones to manage exits.
Weekly Chart Overview
| Resistance Levels | Indicator Insights | Suggested Strategy |
|---|---|---|
| 1.08172 (0.618 Fibo) | RSI below the sell zone, trending upward. Stochastic RSI in sell zone. Crossed lines show upward momentum. | Enter longs if price clears 1.08172. Targets are 1.10576 (0.860 level). Stop below 1.060. |
Insights:
- A move above 1.08172 opens the door for mid-term resistance levels like 1.10576.
- Divergence between RSI and stochastic RSI highlights potential short-term volatility.
Takeaway:
Monitor 1.08172 closely. Break above this level validates bullish momentum. Use trailing stops to protect profits as prices approach resistance.
Daily Chart Overview
| Key Levels | Indicator Insights | Suggested Strategy |
|---|---|---|
| Support at 1.04595-1.04581 | Stochastic RSI moving up to the sell zone. RSI is approaching but not yet in overbought territory. | Look to enter longs near 1.04595 support. Targets are 1.08405. Watch for reversals. |
Insights:
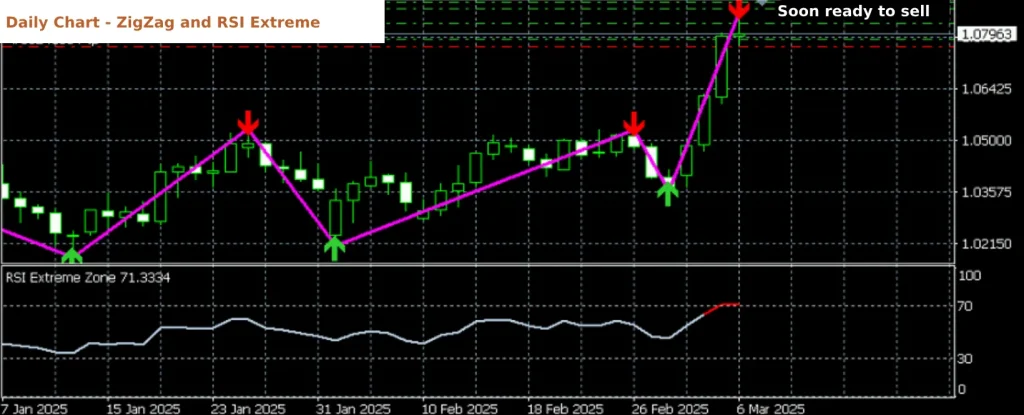
- The daily chart suggests a short-term pullback followed by a surge to key resistance levels.
- Stochastic RSI crossover highlights potential for a short-term bullish move.
Takeaway:
Use pullbacks to support areas like 1.04581 for optimal entry points. Exit positions near 1.08405 as reversal signals may emerge.
Actionable Trading Strategies

Based on insights from all three timeframes, here is a cohesive plan to trade the EUR/USD pair with confidence:
- Entry Point #1: Break above 1.08335 on the monthly chart.
- Target Range: 1.16691
- Stop-Loss Placement: Below 1.07000
- Entry Point #2: Weekly chart resistance break at 1.08172.
- Target Range: 1.10576
- Stop-Loss Placement: Below 1.06000
- Entry Point #3: Daily chart pullback near 1.04595-1.04581 support.
- Target Range: 1.08405
- Stop-Loss Placement: Below 1.04000
Additional Tips for Execution
- Position Sizing: Risk no more than 1-2% of your account balance on a single trade.
- Confirmations: Use RSI divergence and stochastic RSI crossovers as signals to enter or exit trades.
- Trailing Stops: Tighten stops as the price reaches significant Fibonacci lines or key resistance.
Monitoring and Updating
- Watch for new price action developments to adjust your strategy accordingly.
- Keep an eye on news and economic events that could impact major USD or EUR movements.
Risk Management Is Your Shield
The market is unpredictable, which makes a strong risk management plan essential to staying profitable. Here’s how to protect your trades:
- Always trade with predefined stop-loss levels.
- Regularly review the RSI and Fibonacci retracement levels to avoid overtrading.
- Use smaller position sizes in highly volatile market periods.
This is your chance to ride the wave of bullish momentum!
Final Thoughts
This EUR/USD trading setup offers plenty of opportunities if traded wisely. By combining insights from multiple timeframes with disciplined strategies, you can confidently take advantage of market movements. Remember, sticking to your trading plan and practicing patience will ultimately pay off in the long run.
Have your own insights or questions about trading EUR/USD? Comment below or join the discussion on Forex And Profits on Telegram to share your thoughts and strategies!
Optimize your trading game today with this actionable EUR/USD trading plan. Don’t miss out on these opportunities—make your move now!
📊 EUR/USD Analysis Update – Friday, March 7, 2025
- 4-Hour Chart 🕓
RSI divergence detected, signaling potential bullish momentum. The pair could climb to the .270 level at 1.09575. - Weekly Chart 📆
Another RSI divergence hints at possible moves toward the .786 level at 1.09712 or even the .860 level at 1.10727. - Daily Chart 📈
The pair has reached the .860 level at 1.08749. RSI is edging closer to the sell zone, while the stochastic remains in sell territory, with the green and blue lines yet to cross. Upward momentum could persist until the crossover occurs, after which a retrace is expected.
Stay alert and watch these levels closely! 🧐💹 #EURUSD #ForexAnalysis #Trading
Update 11 March 2025:
Simplified EUR/USD Analysis Updates for March 2025
Weekly Overview
The EUR/USD pair could push up to 1.09712 or even 1.10799, but it’s likely to drop afterward. A key downside target is 1.05652, so watch for potential selling opportunities around these levels.
Daily Overview
The pair recently hit a peak and is showing signs of a pullback. Look for a possible drop first to 1.05613 and potentially down to 1.04587. These levels could offer opportunities for buyers to step back in.
4-Hour Snapshot
EUR/USD is consolidating below 1.09601 but could move slightly higher before heading down. Key retracement support to watch is around 1.07073 for potential bounce opportunities.
Key Takeaways
Look for RSI and Stochastic RSI signals to confirm momentum changes before entering trades.
Smart Trading Plan for Beginners Using EUR/USD Analysis
This trading plan is designed for beginners who want to use your EUR/USD analysis to aim for a $100 profit, trading with lot sizes between 0.01 and 0.05. Below are simple steps to get started while managing risk effectively.
Step 1: Define Your Risk Per Trade
- Use 1-2% of your account balance per trade as the maximum risk. For example, if your account balance is $500, keep your risk per trade around $5-10.
- Adjust your lot size accordingly. For example, use 0.01 lots for smaller accounts and scale up to 0.05 lots only when your account can handle it.
Step 2: Target Key Levels for Entry and Exit
Use the analysis to plan your trades around these levels.
- Sell Entries
- Look to open sell positions near resistance zones between 1.09601 and 1.09712, where the pair might reverse downward.
- Set your stop loss above 1.09800 and your take-profit (TP) near 1.07838 for a safe target within a potential downtrend.
- Buy Entries
- If the pair drops to 1.07073, consider buying as the price might bounce at this level.
- Set your stop loss below 1.06850 and TP near 1.09601, targeting the retracement move upward.
Step 3: Lot Size and Position Management
- For each trade, use 0.01-0.03 lots initially to minimize risk. You can increase to 0.05 lots if the account grows and there’s ample margin available.
- Example Profit Calculation: A 50-pip move with a 0.01 lot size would generate around $5. With 0.05 lots, the same move could yield $25. Plan to trade multiple smaller moves to steadily build toward $100 profit.
Step 4: Manage Risk with Stop Losses
- Always place stop losses to limit your losses. For example:
- For a sell trade entered at 1.09601, keep the SL at 1.09800 to avoid large drawdowns.
- For a buy trade near 1.07073, set the SL at 1.06850 to protect your balance.
- Aim for a risk-to-reward ratio of 1:2 for each trade. If risking 10 pips, aim for at least 20 pips in profit.
Step 5: Take Partial Profits and Trail Stops
- Once the price moves favorably, take partial profits at key levels, such as 1.07838 (sell) or 1.09601 (buy).
- Consider trailing your stop loss to lock in profits as the trade progresses.
Example Trades to Make $100
- Trade 1 – Sell at 1.09600
- Lot size: 0.03
- TP: 1.07838
- SL: 1.09800
- Potential profit ≈ $53.
- Trade 2 – Buy at 1.07073 (after a retracement)
- Lot size: 0.05
- TP: 1.09601
- SL: 1.06850
- Potential profit ≈ $75.
Total profit from these trades ≈ $100-128, factoring in some minor deviations.
Step 6: Patience and Discipline
- Wait for the price to hit key zones like 1.09601 or 1.07073 before entering trades. Don’t chase the market.
- Avoid overtrading. Stick to 1-3 trades per day based on strong setups.
By following this smart trading plan, new traders can steadily build profits while minimizing risk. Remember, success comes with patience, discipline, and consistent application of your analysis.