What 3,456 Trades Taught Me About Grid EAs (And Where I Was Wrong)
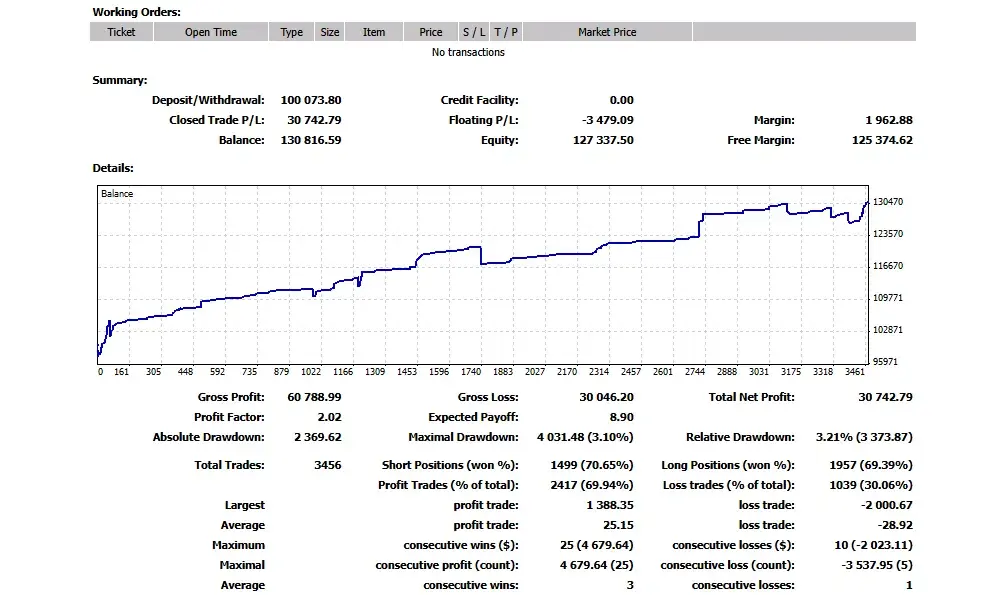
My grid robot turned $100,000 into $130,816 in five weeks on demo. Up 30.7%, and it barely broke a sweat doing it. That’s the headline — and headlines are exactly where people stop reading and start believing. So I didn’t stop. I went through all 3,456 trades one by one. And the log told me three things that flat-out contradicted what I thought I knew about grid trading — including one thing that made a change I’d already shipped look pretty daft. Here’s where I got it wrong.
✅ Read this first: This is a RoboForex demo — five weeks, gold, Bitcoin and US30. No real money. Demo fills aren’t the same as real ones, and five weeks proves roughly nothing. I’m sharing it because the digging changed my mind on something, not because 30% on a demo means a single cent of real profit. Stick around to the end, because the most important bit is the risk I haven’t sorted yet.
The setup: 3,456 trades, 1,619 baskets
- +$30,742.79 net (30.7%) over five weeks, 30 July – 4 September
- Profit factor 2.02, win rate 69.94%, max drawdown 3.10%
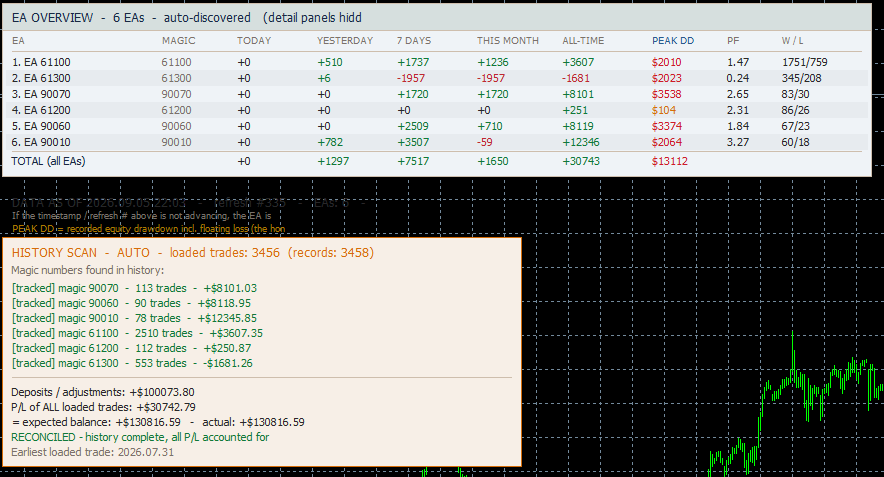
- 3,456 individual trades that bundled up into 1,619 “baskets”
- Traded on gold (XAUUSD), Bitcoin (BTCUSD) and the US30 index
Quick word, because the whole article hangs on it: a basket (or “series”) is one grid cluster — a bunch of trades on the same thing that open and close together as a group. The robot ladders into these. So those 3,456 trades became 1,619 baskets. Right, now here’s where it gets interesting.
Finding 1: the deep baskets were the BEST baskets — and it did my head in
Here’s what every grid trader “knows,” me included: the deeper a ladder goes, the more dangerous it is. More trades stacked up, more exposure, more chance of the whole thing going bang. I believed that so firmly I’d already built a version that capped how deep the ladder could go.
Then I sorted every basket by how many trades deep it went:
| Legs | Baskets | Win rate | Avg net per basket |
|---|---|---|---|
| 1 | 433 | 91% | +$42.01 |
| 2 | 835 | 87% | +$3.34 |
| 3 | 222 | 96% | +$23.01 |
| 4 | 44 | 89% | −$13.46 |
| 5 | 35 | 89% | +$112.36 |
| 6 | 22 | 95% | +$98.22 |
| 7 | 28 | 86% | −$30.37 |
The 5- and 6-leg baskets win nearly as often as the shallow ones — and earn about thirty times more per basket than a 2-leg. (The 4- and 7-leg rows are tiny samples, 44 and 28 baskets, so don’t read too much into those.)
The reason’s actually simple once it clicks. A deep ladder drags the basket’s average price down close to where the market is right now. So a 6-leg basket might only need a 2% bounce to close in profit — while a single stranded trade needs price to crawl all the way back to where it started. The depth isn’t the danger. The depth is the engine.
I’d capped the exact thing that was making most of the money. I built that depth cap because I was sure deep ladders emptied accounts. The data says the cap was choking off the baskets doing the heavy lifting. So I ripped it out. But hang on — if you’ve read my other posts, you should have alarm bells going off right about now. I did too.
Hang on — didn’t I say deep ladders BLOW UP ACCOUNTS?
Yep. I did. More than once. If you’ve followed along, you’ve read my TrendLab breakdown, where deep baskets blew up a real account — a ladder that ran to 8.81 lots and went off like a firework. You’ve read my v5 breakdown where a recovery ladder basically made its own losses. And now I’m telling you deep baskets are the money-maker? Have I completely lost it?
No — and squaring these two things up is the most important idea in the whole article, so read this bit twice. Depth isn’t the risk. Depth with no limit, in a market that trends is the risk.
- In the TrendLab and v5 disasters, the deep ladders blew up because they kept averaging into a market heading one way and never coming back. Price ran, the ladder kept piling in, the floating loss went straight up. Bang.
- In this data, the deep baskets won because the market kept bouncing back. Over these five weeks price kept retracing — so the averaging did its job and the baskets closed green.
Both are true. Same mechanic, two completely different market moods. Deep grids are a money machine when price bounces around — and a wrecking ball when price trends against you with nothing to stop it. My earlier breakdowns weren’t wrong. This isn’t wrong either. The thing I’d been missing wasn’t the depth number — it was what the market was doing.
Finding 2: winners close fast, and there’s no long tail
Across all 1,619 baskets, here’s how long they stayed open:
- Typical winning basket: 8 minutes
- 99% of winners wrapped up within 2.21 days
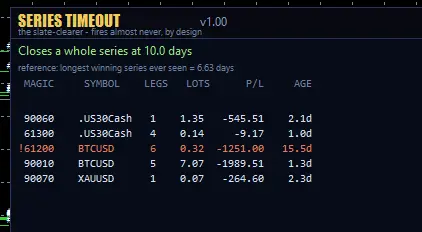
- Longest basket ever, winner or loser: 6.63 days
Nothing — not one — stayed open longer than 6.63 days. That’s handy to know: a genuinely old basket is a rare bird, not just the quiet end of some big scary range.
Finding 3: every “close it after X days” rule I tested LOST money
This is the one I didn’t see coming, and it’s the one most likely to save you from a “safety” feature that quietly robs you.
The obvious move after Finding 2: “just close anything older than X days.” Sounds sensible and responsible, right? So before I trusted it, I tested it against the real history — what would each cut-off actually have saved, versus thrown away?
| Cut at | Baskets hit | Losses avoided | Profits thrown away | Net effect |
|---|---|---|---|---|
| 3 days | 12 | $4,375 | $5,174 | −$799 |
| 4 days | 4 | $1,275 | $4,261 | −$2,987 |
| 5 days | 2 | $0 | $3,907 | −$3,907 |
| 7 days | 0 | — | — | $0 |
Every cut-off that actually did anything lost money. Cutting at 5 days would’ve thrown away $3,907 in profit and stopped exactly nothing — both those “old” baskets ended up green anyway.
Of the 26 baskets that ran past 2 days, 21 closed in profit. The old baskets weren’t sick. They were doing exactly what a grid’s meant to do: waiting. And a timer would’ve shot them right before payday.
Here’s the sneaky trap: a rule that closes trades on a timer feels responsible. But on this data it would’ve turned a working system into a worse one — and you’d never have known. The losses it “saved” you from would be right there, plain to see and reassuring. The profits it quietly killed? Invisible. You’d feel safe while slowly bleeding out.
If you take one thing from this whole article, make it this: before you bolt a “safety” rule onto a system, test what it would have COST you on your own history — not just what it would’ve saved. The losses it prevents shout at you. The profits it kills keep their mouths shut.
Finding 4: the thing that traded the most, earned the least
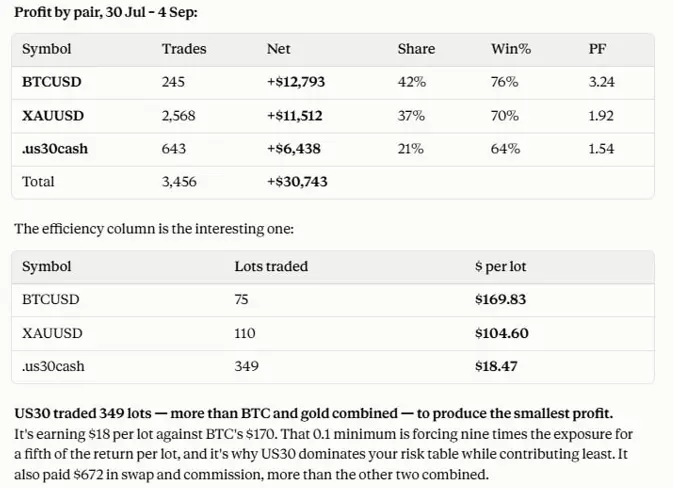
US30 traded more volume than Bitcoin and gold put together — and made the smallest profit while paying more in swap and commission than the other two combined. Why? Nothing to do with the strategy. It’s a contract detail: on this account US30 starts at 0.1 lots where gold and Bitcoin start at 0.01. So every ladder step was ten times bigger than I meant it to be. The robot wasn’t choosing that risk — the contract spec forced it on me.
Go check this on your own account right now: right-click each symbol → Specification in MT4/MT5. A “0.01 minimum” on one thing can quietly be 0.1 on another — at the same broker — and all your careful position sizing goes straight out the window without you noticing.
Finding 5: same robot, two brokers, opposite results
Same weeks, a similar setup on a second broker’s demo. That account was down about $50,000 while this one was up $30,000. Tempting to scream “the broker’s rigging me!” — but I won’t, because the obvious answer is probably the wrong one. The losing account wasn’t running the same lineup: no US30, and heavily short Bitcoin right as Bitcoin ripped from about $60k to $79k — a 25% jump in three weeks. A patient grid on the wrong side of a move like that sits underwater on anybody’s server. Some of the gap is execution; some is just what it was trading and when. I can’t cleanly split the two, so I’m not going to pretend I can. But running the same system in two places showed me a weak spot one account on its own would’ve hidden.
What I actually changed
- Ripped out the depth cap — Finding 1 says it was strangling the best baskets.
- Deep baskets now ask for more — a 6-leg basket earns faster per point, so holding it to a single-trade target leaves money on the table.
- Targets now flex with how wild the market is instead of a fixed dollar amount.
- Swap and commission get added onto the target — so a basket held four days closes green after the costs, not before.
- A 10-day basket timeout, set deliberately above the 6.63-day record — so it only ever clears a genuinely dead position. On this history it would’ve fired zero times.
The risk I have NOT sorted — read this before you get any ideas
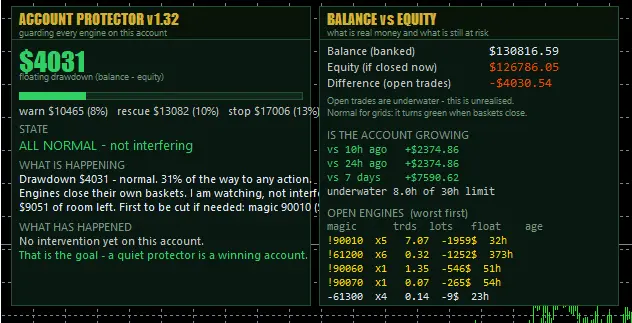
Here’s the honest gap, and I’m putting it in bold because it matters more than the 30%: ripping out the depth cap means these deep baskets now run with no limit. They worked here because the market kept bouncing back for five weeks. I have not sorted the case where a market trends hard against a deep basket and just doesn’t come back — which is exactly what blew my accounts before. My 10-day timer does not fix this. A timer limits how long you wait, not how much you lose. Totally different problem.
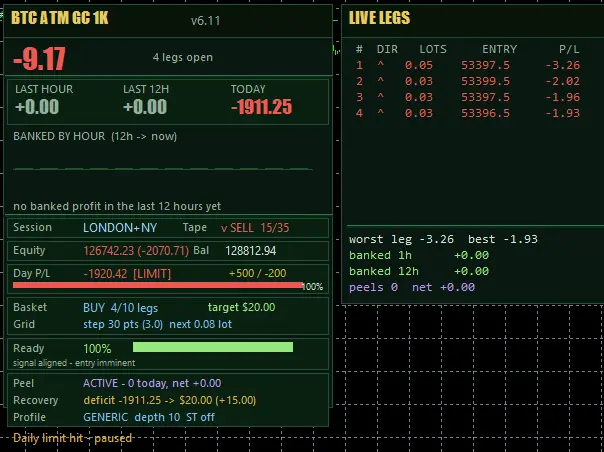
Let me be blunt about why this stays on demo. The protector I’ve built so far is tuned to a kind, bouncy market — because that’s the only month of data I’ve got. The real safety net this robot needs before it goes anywhere near real money is a floating-loss limit: a rule that closes a basket when it’s underwater by a set slice of the account, no matter how old or how deep it is. That’s the thing that would’ve caught the old disasters. I haven’t built it yet, and that’s on purpose — because I’ve learned the hard way that piling on protection too early just strangles the robot and gives you bad days for nothing (see Finding 3 — that’s not a hunch, it’s right there in the data). I want to see what it can really do first, then add the proper limits once I’ve got more data. That’s the plan. Demo till then.
And the question everyone’s going to ask: if this had run on a $1,000 cent account and behaved like this demo, it’d be up around 30%. But that “if” is doing a lot of heavy lifting. It’s a demo. One month proves nothing. A single hard trend into an uncapped deep basket could wipe out a good chunk of that fast — and until I’ve built the floating-loss limit and tested it, that risk is real and unsolved. I’d rather tell you that straight than sell you the 30%.
📘 New here? What is grid trading?
A grid robot doesn’t try to guess which way the market’s going. Instead it builds a “ladder” of trades. Here’s the idea in four steps:
- 1. Open a trade. The robot buys (or sells).
- 2. Price goes against it? Instead of closing for a loss, it opens another trade at the new, worse price.
- 3. Keep laddering. Each new “leg” drags the group’s average price closer to now — so the market only has to bounce back a little, not all the way, for the whole batch to profit.
- 4. Close the whole “basket” together once it’s in the green.
The catch — and it’s a big one:
- ✅ When the market bounces around (ranges), it works a treat — lots of small, reliable wins.
- ❌ When the market keeps heading one way and doesn’t come back, the ladder keeps piling on losing trades, the combined loss grows fast, and — with no limit — it can drain the whole account.
That second one isn’t a rare glitch. It’s the classic way grid accounts blow up, and I’ve had it happen to my own more than once — it’s all on this site. So when you see me go on about “baskets,” “legs” or “depth” below — that’s the ladder. And when I bang on about drawdown and limits, that’s me trying to survive the one thing that kills these systems.
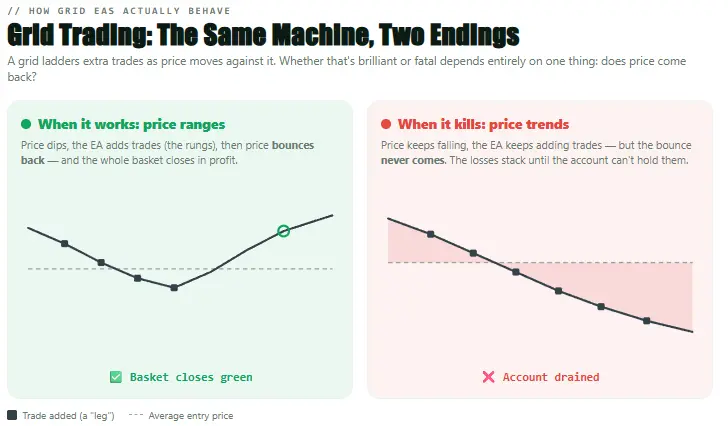
The honest point: the mechanic is identical in both panels — same laddering, same logic. The only difference is whether the market bounced or trended. That’s why grids can look perfect for weeks and then blow up in a day: they work right up until a trend shows up. The whole job of risk control is surviving the right-hand panel.
Where I landed
I got it wrong twice in this analysis. I shipped a depth cap the data flat-out contradicted. And I nearly added a spacing rule before I bothered to check that winning baskets actually ladder tighter than losing ones. Both sounded clever. Both got shot down by my own trade log. That’s the whole point of digging through your history instead of just reasoning about it from your armchair — the log doesn’t care what sounds smart.
The system looks good on demo. The deep-basket finding is real. And the biggest risk is still sitting right in front of me, named and unsolved. I’ll post whatever happens next — the floating-loss limit, the forward test, all of it — wins and losses, same as always.
Want to dig deeper on this robot and where these ideas came from?
- How this robot looked when it was still earning — before the analysis that changed my mind, back when it was running steadily on demo.
- The two-second losing trade that gave away a one-line bug — the breakdown of an earlier version of this same machine.
- The breakdown of 10,328 grid trades — where I first showed how deep ladders blow up real accounts.
Important: All results are from a demo account. Demo trading doesn’t reflect real execution, slippage, or liquidity. Grid strategies carry a very high risk of large or total loss, especially in trending markets — as I’ve documented all over this site. The cent-account figure is a hypothetical, not a result or a promise. Past and demo performance doesn’t predict future results. Nothing here is financial advice. Never trade money you can’t afford to lose.