Silver (XAG/USD) is presenting traders with a dynamic mix of opportunities. With signals ranging from short-term buy indicators to mixed trends on higher timeframes, this article dives into the XAG/USD technical analysis to help you make informed trading decisions. Alongside the analysis, you’ll find a robust set-and-forget trading plan, designed to enter trades strategically without relying on stop losses.
If you’re in the market for insights into silver trading strategies or looking for actionable steps to optimize your positions in the silver market, read on.
Technical Overview
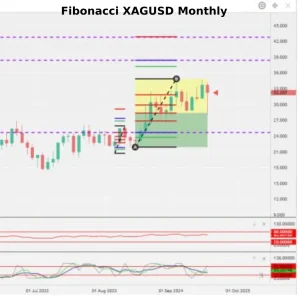
Monthly Chart Analysis
The Stochastic RSI on the monthly chart has entered the buy zone. Notably, the green and blue lines have crossed, often signaling a potential long-term upward move for XAG/USD. This could mark the beginning of bullish momentum.
Weekly Chart Analysis
The weekly time frame reveals a neutral stance, with both the RSI and Stochastic RSI hovering in the middle range. However, there’s the possibility of a retracement down to the 0.618 Fibonacci level at 29.551, which serves as a pivotal area of support in the larger structure.
Daily Chart Analysis
On the daily chart, momentum appears bearish in the short term. Both the Stochastic RSI and RSI are pointing downward, suggesting further declines. Watch for critical levels like the 0.236 Fibonacci level at 31.871 and the 0.382 Fibonacci level at 31.081 for potential price reversals.
4-Hour Chart Analysis
XAG/USD is trading within a channel, ranging from 33.566 to 32.220. It’s hovering near the bottom of this channel, presenting an opportunity for a potential bounce. The Stochastic RSI is already in the buy zone, but the green and blue lines are yet to cross. Strong support is seen around 31.633, which corresponds to the 0.382 Fibonacci level.
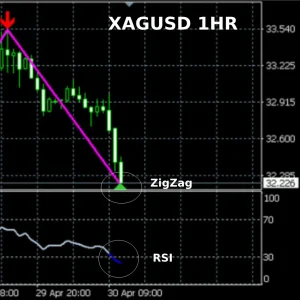
1-Hour Chart Indicators
Short-term indicators like Zigzag Extremium and RSI Extreme have flashed buy signals. While these signals point to short-term upward momentum, be cautious, as higher timeframes still show mixed trends.
Expanded Set-and-Forget Trading Plan

Key Strategy
The focus here is on placing pending trades at key support levels, avoiding tricky stop-loss areas, and waiting for the market to confirm trend changes. By utilizing this strategy, you’ll give silver the space to fluctuate naturally while still positioning for long-term success.
Layered Pending Orders
- Pending Buy Order 1
- Entry: 31.871 (0.236 Fibonacci – Daily Chart)
- Reasoning: Positioned near a minor retracement zone, this level offers a natural entry for potential bullish moves.
- Pending Buy Order 2
- Entry: 31.633 (0.382 Fibonacci – 4-Hour Chart)
- Reasoning: Aligns with critical support on the 4-hour timeframe, creating another opportunity for a bounce.
- Pending Buy Order 3
- Entry: 31.081 (0.382 Fibonacci – Daily Chart)
- Reasoning: Stronger support zone where buyers may step in for aggressive recovery trades.
- Pending Buy Order 4
- Entry: 30.500 (Custom Support Level)
- Reasoning: A psychological round number and common area for silver buying activity.
- Pending Buy Order 5
- Entry: 29.551 (0.618 Fibonacci – Weekly Chart)
- Reasoning: A deeply discounted yet highly reliable support zone, ideal for holding long-term positions.
Take Profit Levels
- Take Profit 1: 33.532 (Channel Top – 4-Hour Chart)
- Take Profit 2: 34.500 (Next Resistance Level)
- Take Profit 3: 36.000+ (Long-Term Target)
Risk Management Suggestions
- Allocate smaller position sizes across all pending trades to mitigate risks.
- Monitor momentum indicators, such as RSI, on the daily and 4-hour charts to confirm or adapt your strategy.
- Be patient; stick to the plan and avoid chasing price movements.
Benefits of This Approach
This XAG/USD technical analysis blended with a tailored trading plan allows you to avoid the common pitfalls of using stop losses in a volatile market. By strategically placing buy orders at deeper retracement levels, you can align with silver’s eventual bullish trend without getting stopped out by temporary price noise.
Why XAG/USD Technical Analysis Is Crucial
Silver trading demands a disciplined approach backed by a clear understanding of technical indicators and support zones. Using insights gained from comprehensive technical analysis at multiple timeframes, you’re empowered to make more confident and calculated trading decisions. Whether you’re new to the silver market or a seasoned trader, this methodology offers a balanced framework for success.
Final Thoughts
By following this expanded trading plan and relying on key data points from the XAG/USD technical analysis, you can position yourself effectively in the silver market. Remember, the key to success lies in patience and discipline. Monitor the evolving trend, stick to your levels, and focus on long-term gains rather than short-term fluctuations.
Silver’s market volatility always poses risks, but with the strategies outlined here, you’ll be better equipped to turn opportunities into profit. Wishing you smooth trades and high returns! 💹
Meta Description: Discover a complete XAG/USD technical analysis and expanded silver trading plan. Learn how to set pending trades at key levels for long-term success while avoiding stop-loss pitfalls.
Tags: #XAGUSD #TechnicalAnalysis #SilverTrading #ForexStrategy