My Keltner Channel Gold EA: Seven Versions, One Survivor
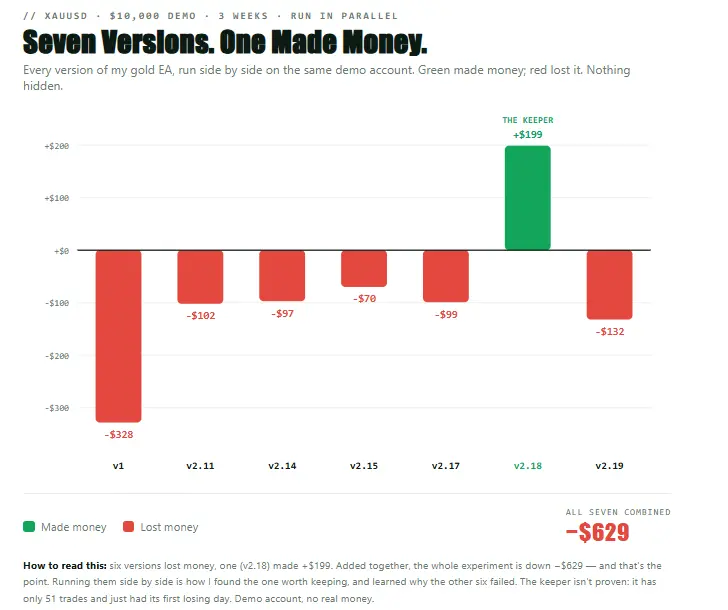
I ran seven versions of my own gold EA side by side on demo for three weeks. Six of them lost money. The seventh made +$199. And I’m going to show you all seven — because the story isn’t “I built a winner.” It’s something far more useful: I built a process that tells me, fast and in plain numbers, when an EA has stopped working. That process is the real result, and it’s worth more than any single version.
✅ Read this first: Every number here is from one $10,000 demo account (RoboForex ECN, gold, MT5), three weeks, all versions running in parallel. No real money. The combined result across all seven versions is −$629, and I’m publishing that number because it is the point. Nothing here is for sale, nothing is proven, and the one version in profit has only 51 trades behind it. This is the journey, shown honestly — the losers included.
The Keltner EA project: seven versions, one survivor (so far)
I’ve been building a gold EA around the Keltner Channel for a long while. Most versions failed fast. A few made money for a few days, then quietly changed character and started losing. So this time I did something different: I ran seven versions at the same time, on the same account, and let the results speak. Here’s the honest scoreboard:
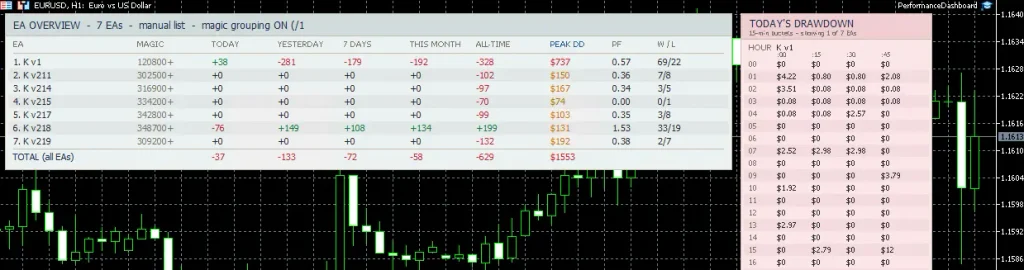
| Version | Result | Peak drawdown | Profit factor |
|---|---|---|---|
| v1 | −$328 | $737 | 0.57 |
| v2.11 | −$102 | $150 | 0.36 |
| v2.14 | −$97 | $167 | 0.34 |
| v2.15 | −$70 | $74 | — |
| v2.17 | −$99 | $103 | 0.35 |
| v2.18 | +$199 | $131 | 1.53 |
| v2.19 | −$132 | $192 | 0.38 |
| Total | −$629 | $1,553 |
All seven versions, three weeks, gold demo. Six lost, one won. This table is the whole article — everything below explains what it taught me.
Now here’s why I’m genuinely excited about this, despite a red total: the three most valuable lessons I’ve learned in months of building came out of these failures. Let me show you the three that flipped my assumptions upside down.
Reversal 1: my highest win rate had my worst drawdown
Version 1 won 69 of 91 trades — a 76% win rate. On paper, the best-looking version on the board. In reality, the single worst performer: −$328, with a $737 drawdown, more than four times any other version.
Win rate is not a risk measure. Drawdown is. v1 looked brilliant right up until it met a market that didn’t come back — and then the drawdown column told the truth the win-rate column had been hiding all along.
How did a 76% winner lose the most? It exits at basket level — it closes a group of trades when the group is net positive, so a losing position is never realised on its own; a winner drags it out. Measured over one 23-trade sample, the pattern is stark: v1 averaged a +$7.73 win and a −$4.46 loss at an 83% win rate, while the v2 family won only 32% of the time but with a similar average win of +$8.62 — against an average loss of −$29.99. The wins were the same size. The entire difference was in the losses. v1 simply hid its losses inside baskets until one basket wouldn’t close green. That’s not an edge. That’s a delay.
Reversal 2: my “improvement” made it six times worse
I took v2.18 — the one version making money — and “improved” it. I tightened the stop from 1.20 ATR to 0.70 ATR, on the obvious-sounding theory that smaller losses would help. I called it v2.19.
Result: 2 wins, 7 losses, −$132. Six times worse than the version I started from.
A tighter stop is not automatically a safer stop. At 0.70 ATR on M15 gold, the stop sits inside the market’s normal noise. Trades were killed by ordinary movement before the idea ever had room to breathe. The stop has to sit outside the instrument’s noise, or it quietly converts your winners into losers.
This one stung, because it’s the exact kind of “obvious improvement” I’ve shipped before without testing. Running it side by side with its parent is the only reason I caught it.
Reversal 3: the EA could only buy
Over one 22-trade session, the EA took 22 longs and zero shorts — while gold fell from 4681 to 4636. Every single stop-out was a long position in a falling market. It was structurally incapable of profiting from the move actually happening.
The cause was one line of logic: the higher-timeframe trend filter was binary — if price is above the EMA50, bias is long, full stop. In a multi-week gold uptrend, that pinned the bias permanently long and vetoed every short signal the EA ever generated.
A filter that never changes state isn’t a filter — it’s a hard-coded direction. Check what yours actually returns over a real sample. Mine said “long” for weeks straight and I’d never have known without counting.
The fix was a neutral zone: bias only registers when price is more than 0.75 ATR from the EMA. Inside that band, both directions are free to trade. A filter should be able to say “I don’t know” — mine couldn’t, so it never shut up.
How the EA actually works
The strategy is a standard Keltner Channel — a 20-period EMA with bands set 2.0 ATR above and below — scanned across M15, M30, H1 and H4 at once. What makes it different is that it runs three sub-strategies but only ever arms one at a time:
- Pullback (for trending markets): buy a dip back through the middle EMA.
- Breakout (for expanding volatility): enter when a bar opens and closes outside the outer band.
- Fade (for ranging markets): when price closes outside a band, target the middle.
Why only one? Because each of these works in exactly one market state and loses in the other two. Run all three at once and they net to zero. So the EA has a “regime router” that measures the market’s current character — is it trending or chopping, are moves persisting or reverting, is volatility expanding or dying — then replays all three strategies over the last 160 bars and arms whichever one the market is currently rewarding. And critically: if none of them score positive, it arms nothing. Standing aside is a position.
The part I’m most proud of: it watches itself on four horizons
This is the real invention, and it applies to any EA, not just this one. The system supervises itself on four timescales at once:
- Intraday: if the account is down 3% on the day, it flattens and stands down until tomorrow.
- Last ~10 trades: if recent results turn negative, it cuts size and tightens entries.
- Per strategy and timeframe: it can suspend just the specific bucket that’s losing — say, only the H1 breakouts — while the rest keeps working.
- Months: here’s the metric almost nobody uses — days since the last equity high.
Drawdown duration, not just depth. A system that hasn’t made a new equity high in 60 trading days is broken — even if it never had a single frightening day. A slow bleed passes every short-term check while quietly killing the account. So at 60 days without a new high, the EA hard-stops and demands a human look at it. “Trade smaller” is not the answer to that. “Stop and investigate” is.
There’s also a shadow mode: when the EA is in a drawdown, it keeps generating and scoring its signals on paper, with zero money at risk, and only resumes live trading once that paper record recovers. It’s the only honest way I’ve found to tell “the strategy actually broke” apart from “this is just normal variance” — without paying real losses to find out which.
The uncomfortable math: 51 trades tells you almost nothing
Here’s the part I have to be honest about, especially on a day when I’d love to celebrate. v2.18’s win rate is 64.7%, from 33 wins and 18 losses. That sounds convincing. Run the actual statistics on it, though, and the range of what those 51 trades could really mean is enormous: the true win rate could plausibly sit anywhere from about 53% to 75%. Its break-even win rate is 53.2%.
A positive result over 51 trades is completely compatible with having no real edge at all. There’s roughly a 1-in-20 chance the true edge is actually negative and I’m just looking at a lucky streak. That’s not pessimism — it’s arithmetic. 51 trades is not evidence. It’s a hint.
And this is exactly why the “recover your losses with a bigger account” idea is a trap. If I funded a larger account to win back a loss and it blew, the honest reading isn’t “bad luck, try again bigger.” It’s that the blowup itself is evidence the edge I measured was never real — and putting more money behind it makes the hole deeper. A loss chased with more capital is $700 risked to win back $100, at odds that get worse each round.
Why gold demands a cent account
One practical, honest note for anyone tempted to run something like this small. On gold, 0.01 lots with a 1.20-ATR stop risks about $14 per trade. On a $100 standard account, that’s 14% of the account on a single trade — fatal regardless of how good the strategy is. On a cent account, that same 0.01 lots risks about $0.14 — a sane 0.14%. For gold on a small account, a cent account isn’t a preference. It’s a requirement. The minimum lot size, not the strategy, is the real constraint.
So where does this leave me — honestly?
I had my first losing day on v2.18 today. −$76. And I’ll be straight about how I read it, because pretending would defeat the whole point of this site: I don’t yet know if today was just one bad day, or the first day of the same pattern that’s killed every version before it — good for a while, then a quiet shift into losing. Three profitable weeks followed by three losing months is a real and common pattern, and I can’t rule it out on 51 trades.
But here’s why I’m genuinely optimistic, and it’s not wishful thinking — it’s the whole reason I built the supervision layer: I no longer have to guess. If today was variance, the system keeps trading and recovers. If it’s the start of a real breakdown, the four-horizon monitor will catch it — the 10-trade check, the per-bucket suspension, or ultimately the 60-day hard stop — and it’ll pull the plug long before a slow bleed becomes a blown account. A single losing day I can recover from easily, if it’s just a day. And now I have the tools to find out which it is, fast, in plain numbers, instead of hoping.
That’s the shift that matters. For years my EAs failed and I found out too late. Now I’m building v2.20, and whatever it does, I’ll know quickly whether it’s real. The value was never going to be one magic version. It’s a process that tells you the truth about your trading — quickly, honestly, and by stopping when it should.
Most retail EA failure isn’t the broker taking your money. It’s trading an edge that was never measured, sizing it wrong, and adding to losers. All three of those are fixable — and all three are sitting right there in that table of seven versions. I’ll publish v2.20’s results here too. Winners and losers, same as always.
Important: All results shown are from a demo account. Demo trading does not reflect real execution, slippage, or liquidity. No version of this EA has traded real money, none is for sale, and the profitable version has only 51 trades behind it. Past and demo performance does not indicate future results. Nothing here is financial advice. Automated trading carries substantial risk of loss, including total loss of capital. Trade only capital you can afford to lose.
If you want to explore these ideas further:
- What 3,456 trades taught me about grid depth — the same “run every version side by side” method, with a surprising conclusion.
- The 100% win rate that blows accounts — the full version of the “win rate isn’t risk” lesson from this post.