Maverick Scalper: +$131 on Demo — But One Trade Made It All
New EA, first real numbers — and a lesson in reading your own results honestly. Maverick Scalper finished its first two weeks on demo at +$131.59 with a profit factor of 1.76 and a tidy 4.42% drawdown. Sounds good. But when I pulled the trades apart, I found the entire profit rests on a single trade. Here’s the whole picture, including the part that should make you cautious.
✅ Read this first: This is a Vantage demo account, not live money, and it’s a brand-new EA with only 27 trades — a very small sample. I’m publishing it anyway because the analysis is useful, not because the result is proven. Two weeks and 27 trades tell you almost nothing statistically. What they can tell you is whether the design behaves the way it should.
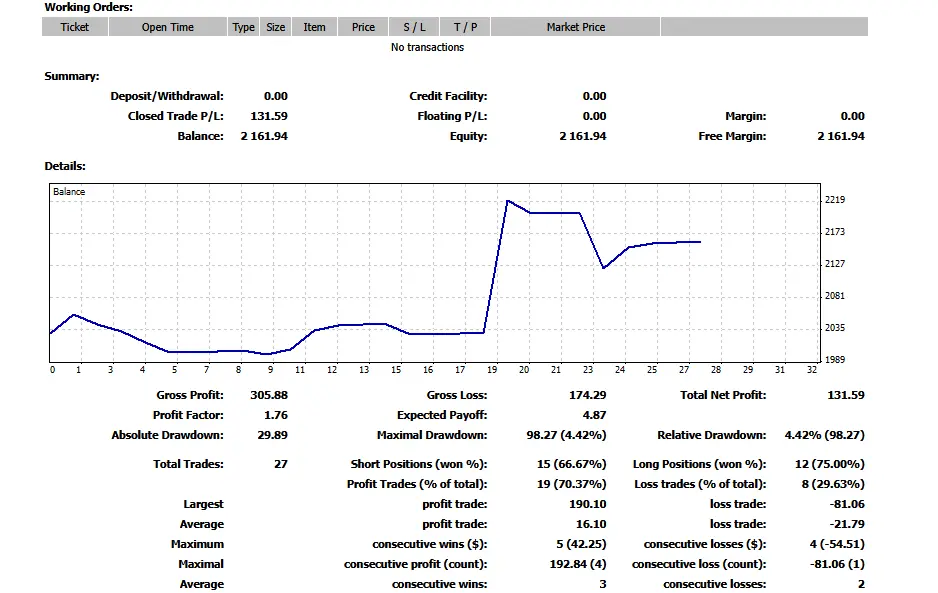
Maverick Scalper results: the real numbers
- +$131.59 net profit over roughly two weeks (2–16 July)
- Profit factor 1.76 — gross profit $305.88 against gross loss $174.29
- Max drawdown 4.42% ($98.27) — genuinely well controlled
- 70.4% win rate — 19 wins, 8 losses from 27 trades
- Every single trade carried a real stop-loss and take-profit
On the surface that’s a healthy first fortnight: high win rate, decent profit factor, small drawdown. But surface numbers are exactly what fools people, so I went deeper.
The uncomfortable finding: one trade is carrying everything
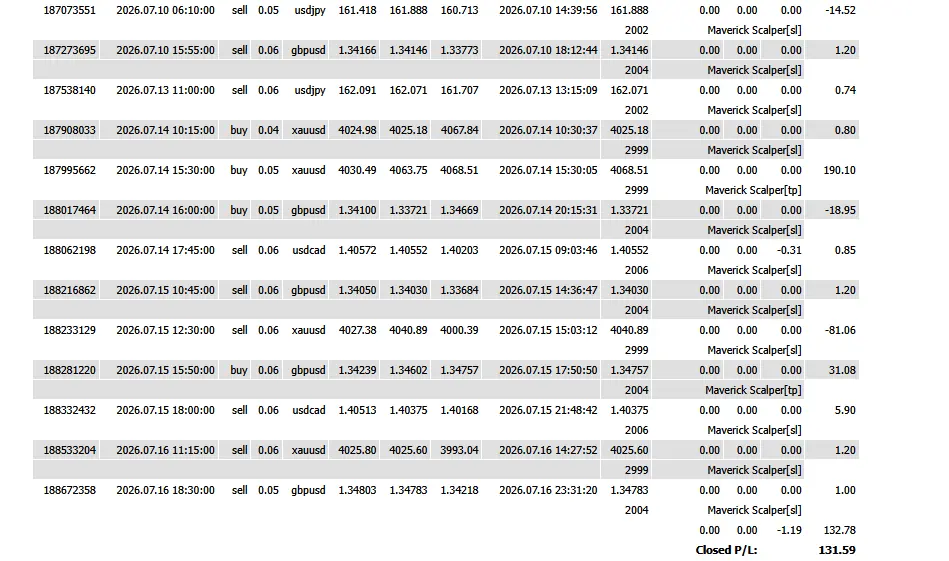
Take away one trade and the account is negative. A single XAUUSD position on 14 July made +$190.10. Remove just that one trade and the other 26 leave the account at −$58.51. The profit isn’t spread across the strategy — it’s concentrated in one lucky moment.
Look at what the other trades actually did. The 18 remaining winners average just $6.43 each. Meanwhile the average loss is $21.79 — more than three times bigger. So the EA wins often but tiny, and loses less often but big. That combination is fragile: it works while the win rate stays high, and it unravels quickly if the win rate slips even a little.
There’s more worth knowing about that big trade. It opened at 15:30:00 and closed at 15:30:05 — five seconds, hitting a take-profit 38 points away on gold. A move that size in five seconds on a demo feed is very likely a data spike or gap-fill artifact, the kind of fill you frequently do not get on a live account with real spreads and slippage. So the single trade holding up the entire result is also the one least likely to repeat with real money.
That’s the honest read: on this evidence, Maverick Scalper has not yet demonstrated an edge. It has demonstrated that it doesn’t blow up — which, as anyone who’s read my earlier posts knows, is not nothing.
How Maverick Scalper actually works
The strategy is a moving-average pullback scalper, and unlike my grid systems it’s built around conventional, disciplined trade management. Here’s the logic in plain language:
- Trend on the higher timeframe, entry on the lower. It reads direction from the 20-period MA on M15 (H1 for gold), then looks for entries on M5 (M15 for gold). It only trades with the established direction.
- It waits for a pullback to the moving average rather than chasing breakouts — the classic “buy the dip in an uptrend” idea, executed mechanically.
- Four confirmation filters before it will enter: clean market structure (higher highs and higher lows for a buy), a sloping — not flat — moving average, no cluster of indecisive candles at the MA, and a rejection wick showing the pullback was actually rejected.
- An ATR volatility filter keeps it out when the market is asleep or wildly volatile.
- Session filter: it trades London and New York hours only, staying out of thin conditions.
The risk framework — the part I’m actually pleased with
This is where Maverick Scalper differs sharply from the grid EAs I’ve written about before, and it’s the reason I’m continuing to test it:
- A real stop-loss on every trade. No averaging down, no recovery ladders, no hoping. If a trade is wrong, it’s cut.
- 1% risk per trade (0.5% on gold), with a hard maximum of 0.10 lots and an extra safety clamp on smaller accounts.
- A minimum 1.5:1 reward-to-risk requirement — it refuses setups that don’t offer enough reward for the risk, which is why you’ll see it skip trades.
- Breakeven and trailing stops. Once a trade is far enough ahead, the stop moves to protect it. You can see this working in the statement: several trades closed for +$0.20 to +$1.20 — those aren’t failures, that’s the EA protecting a small gain rather than letting a winner turn into a loser.
- Circuit breakers: maximum daily trades, a pause after four consecutive losses, and a 10% daily loss limit.
That’s a genuinely conservative framework, and the 4.42% drawdown shows it working as intended. The EA’s problem right now isn’t risk control — it’s that it hasn’t yet proven it can make money consistently.
Honest verdict on Maverick Scalper
I’m cautiously interested, not excited. The design is sound and the protection is real — after the accounts I’ve blown with grid systems, an EA that takes its losses properly is refreshing. But the numbers don’t yet support any claim of an edge: 27 trades is a tiny sample, the profit hinges on one probably-unrepeatable trade, and the average loss being three times the average win is a structural weakness I need to address.
What happens next: it stays on demo, I keep collecting trades until the sample means something, and I look hard at whether the take-profit logic is cutting winners short — because a 70% win rate with wins smaller than losses suggests the EA is banking too early. I’ll publish the next batch of results here whether they’re better or worse.
A fresh start, and what it means: the Vantage demo account these results came from has now expired, so I’m continuing the test on a new IC Trading MT4 demo account. Worth being clear about the implication: the trade count effectively resets, and a different broker means different spreads, different execution and a different data feed — which is actually a useful test in itself. If the results only worked on one broker’s demo feed, that tells me something. The next report will start from zero trades on the new account.
Important: Results shown are from a demo account, not live trading, over a very small sample of 27 trades. Not financial advice. Trading forex and CFDs carries a high risk of loss — most retail traders lose money, and demo performance frequently fails to survive a real account. Past results do not predict future outcomes. These are my own results and opinions. Never trade money you can’t afford to lose.
Want more honest post-mortems like this one?
- The 100% win rate that blows accounts — how one number can hide the truth about a whole system.
- McQuack Scalper 2.5: small profits, tiny 1.55% drawdown — another honest scalper breakdown.