How to use Pivot Point in forex trading
Do you struggle to decide if the market is in buy or sell mode?
Pivot points are one of the most important tools a trader can use because they provide a framework for making trading decisions.
They help you stay on track no matter what the market is doing.
Pivot point meaning
If you’re a forex trader, then you know that pivot points are an important part of your analysis. But what exactly are they, and how can they help you make better trades?
Pivot points are one of the most popular technical analysis indicators because they’re so versatile.
Also, determine the overall trend of the market over different time frames.
This way, you can always make informed decisions about your investments.
Everything you need to know about the pivot points
In this post, we’ll explain everything you need to know about pivot points, and we’ll show you how to use them to improve your trading results.
With pivot points, you can enter and exit trades with confidence, knowing that you have a plan that will work in any market condition.
You’ll never have to worry about second-guessing yourself or feeling lost in the markets again.
I’m going to show you how to use pivot points in trading, and how you can become a more profitable trader using target trading as part of your analysis.
You have probably noticed that I always use target trading in my analysis articles.
What are pivot points in trading?
Pivot Points in forex are an indicator that helps you to find potential turning points. Forex pivots determine the level at which the sentiment of the market could change from bearish to bullish.
As currency traders, we see these as support and resistance.
Calculate these Pivot points or Targets yourself by using our calculator. You can also use any retail forex broker or third-party chart provider that will usually provide this free of charge.
Pivot Points offer chartists a methodology to determine price direction and then set support and resistance levels.
Look at the current period’s price action relative to the pivot point – and there you have the price prediction! Start trading above or below the pivot point, or cross it in either direction during trading.
How to determine the price direction? Use the set support and resistance pointsSource: Stockcharts.com
What do we use pivot points for?
Traders use these pivot points or targets to find their entry, stops, and profit-taking.
Don’t use target trading alone. You must apply your knowledge of Fibonacci, Trend Lines, and Relative Strength Index. This way you will have a much higher probability of finding profitable trading targets.
Don’t look at any potential target and blindly put in a trade waiting for the currency pair to hit the target and give them a profit.
It is a tool like anything else. For some it is highly successful, for others … not so much. You have to find your comfort level with Targets.
I use them as a guide to look for general direction and trend. Use these 3 time frames:
- The Monthly
- The Daily
- 1 Hour
The pivot point is a very basic indicator that includes support and resistance levels.
All these levels help traders see where the price could experience support or resistance. Similarly, if the price moves through these levels it lets the trader know the price is trending in that direction.Source: Investopedia.com
Real examples of how to use pivot points in trading?
GBP CAD 4 Hour (Monthly) Chart:
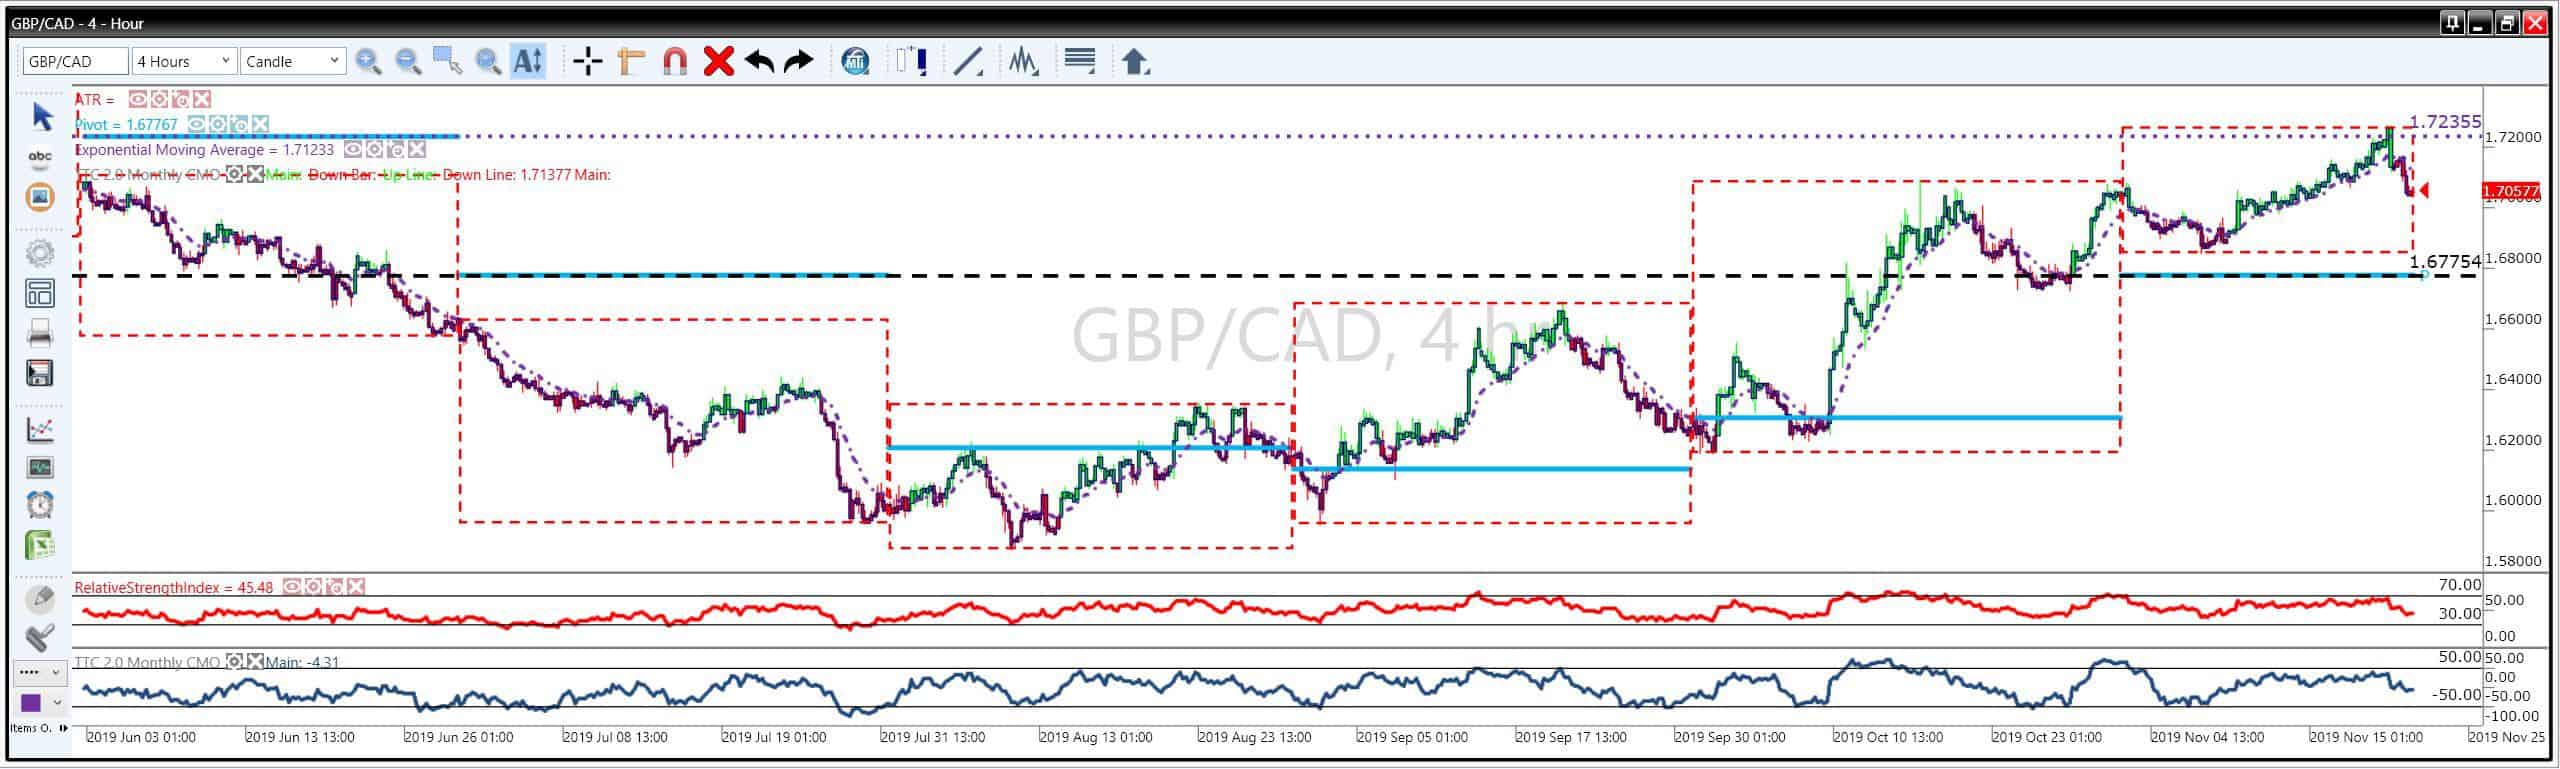
Make sure to trade each target only once. They are no longer any potential targets. See target at 1.72355.
The GBP CAD is now heading down to the next target at 1.67754.
It is heading from the sell zone to the buy zone, according to the RSI.
The monthly chart can take a month – 1 1/2 months to reach the target depending on volatility and market conditions.
GBP CAD 1 Hour (Weekly) Chart:
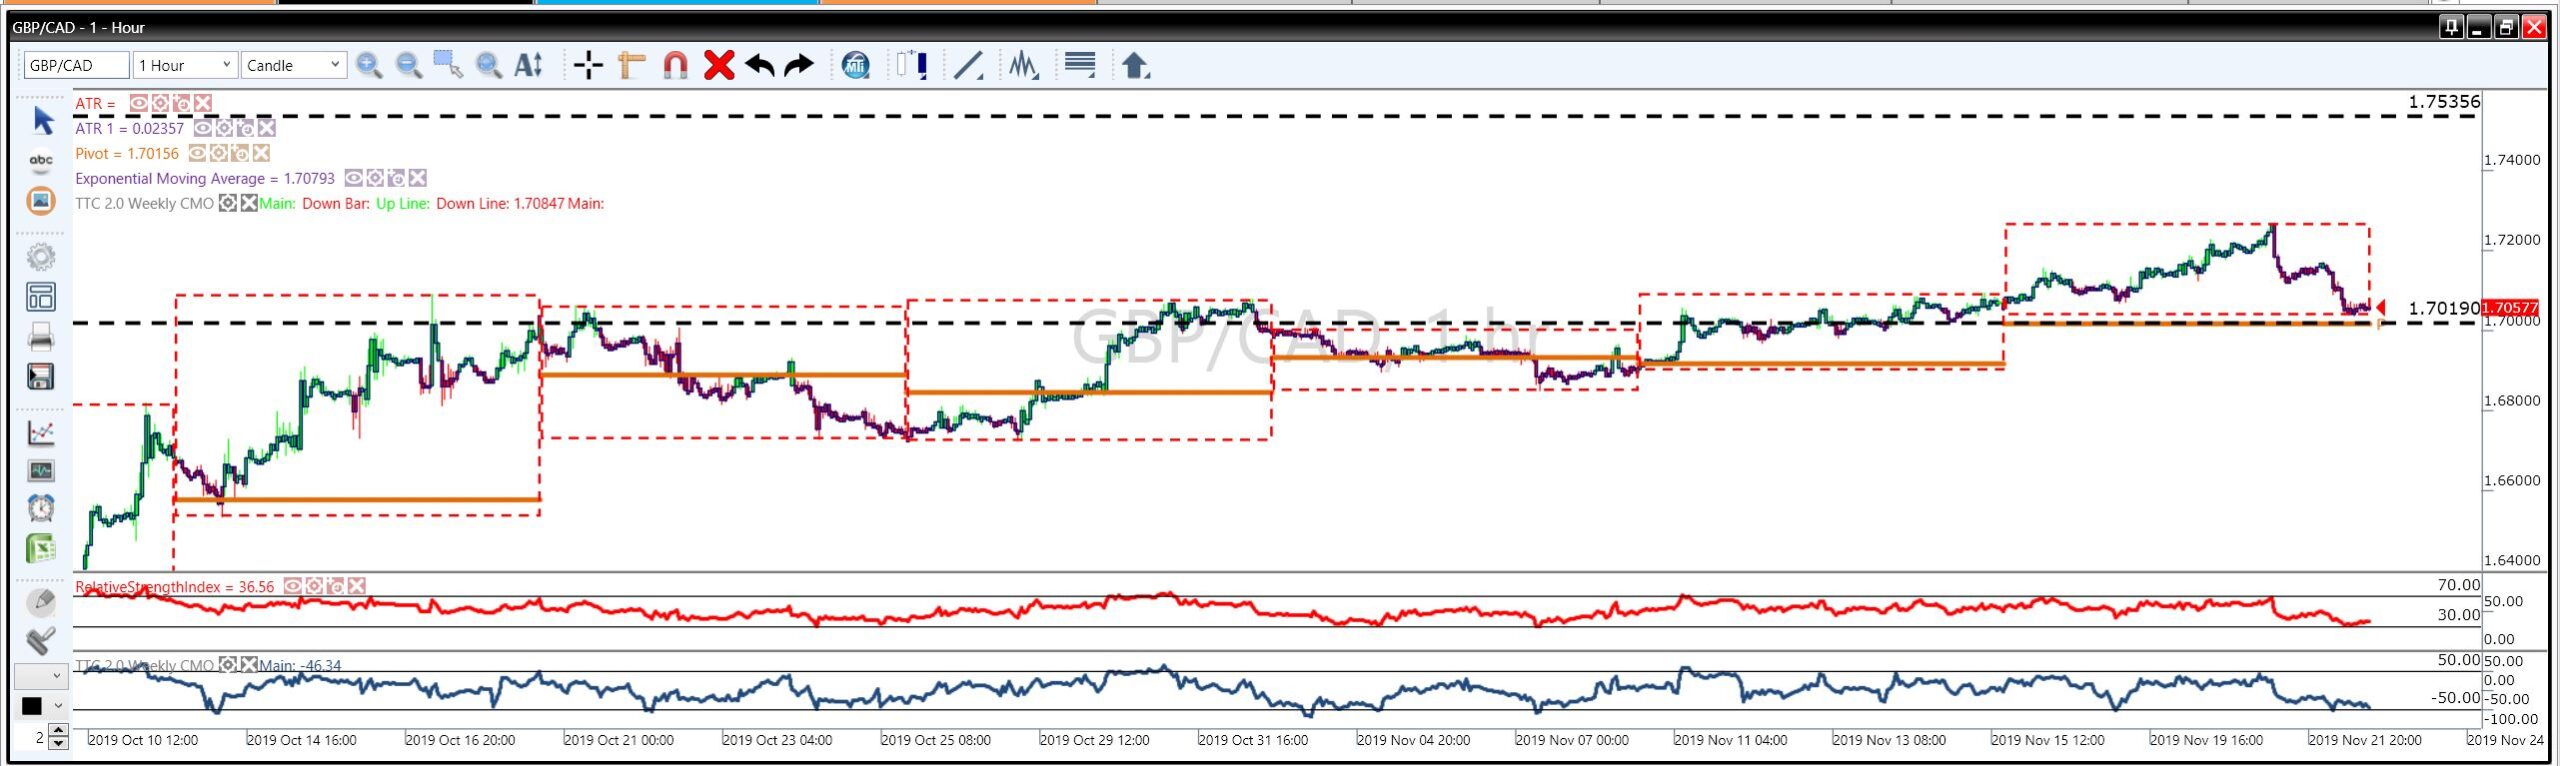
Here the GBP CAD is about to hit its pivot point target at 1.70190 which is 36 pips down from its current position.
Both the RSI and CMO are in the buy position at present, however, further up is an old target at 1.75356 which this pair might bounce up to or a new target may form, not yet visible.
Old targets are not to be taken too seriously. The older the target the less likely the currency will go to it.
GBP CAD 10 minute (1 hour) Chart:
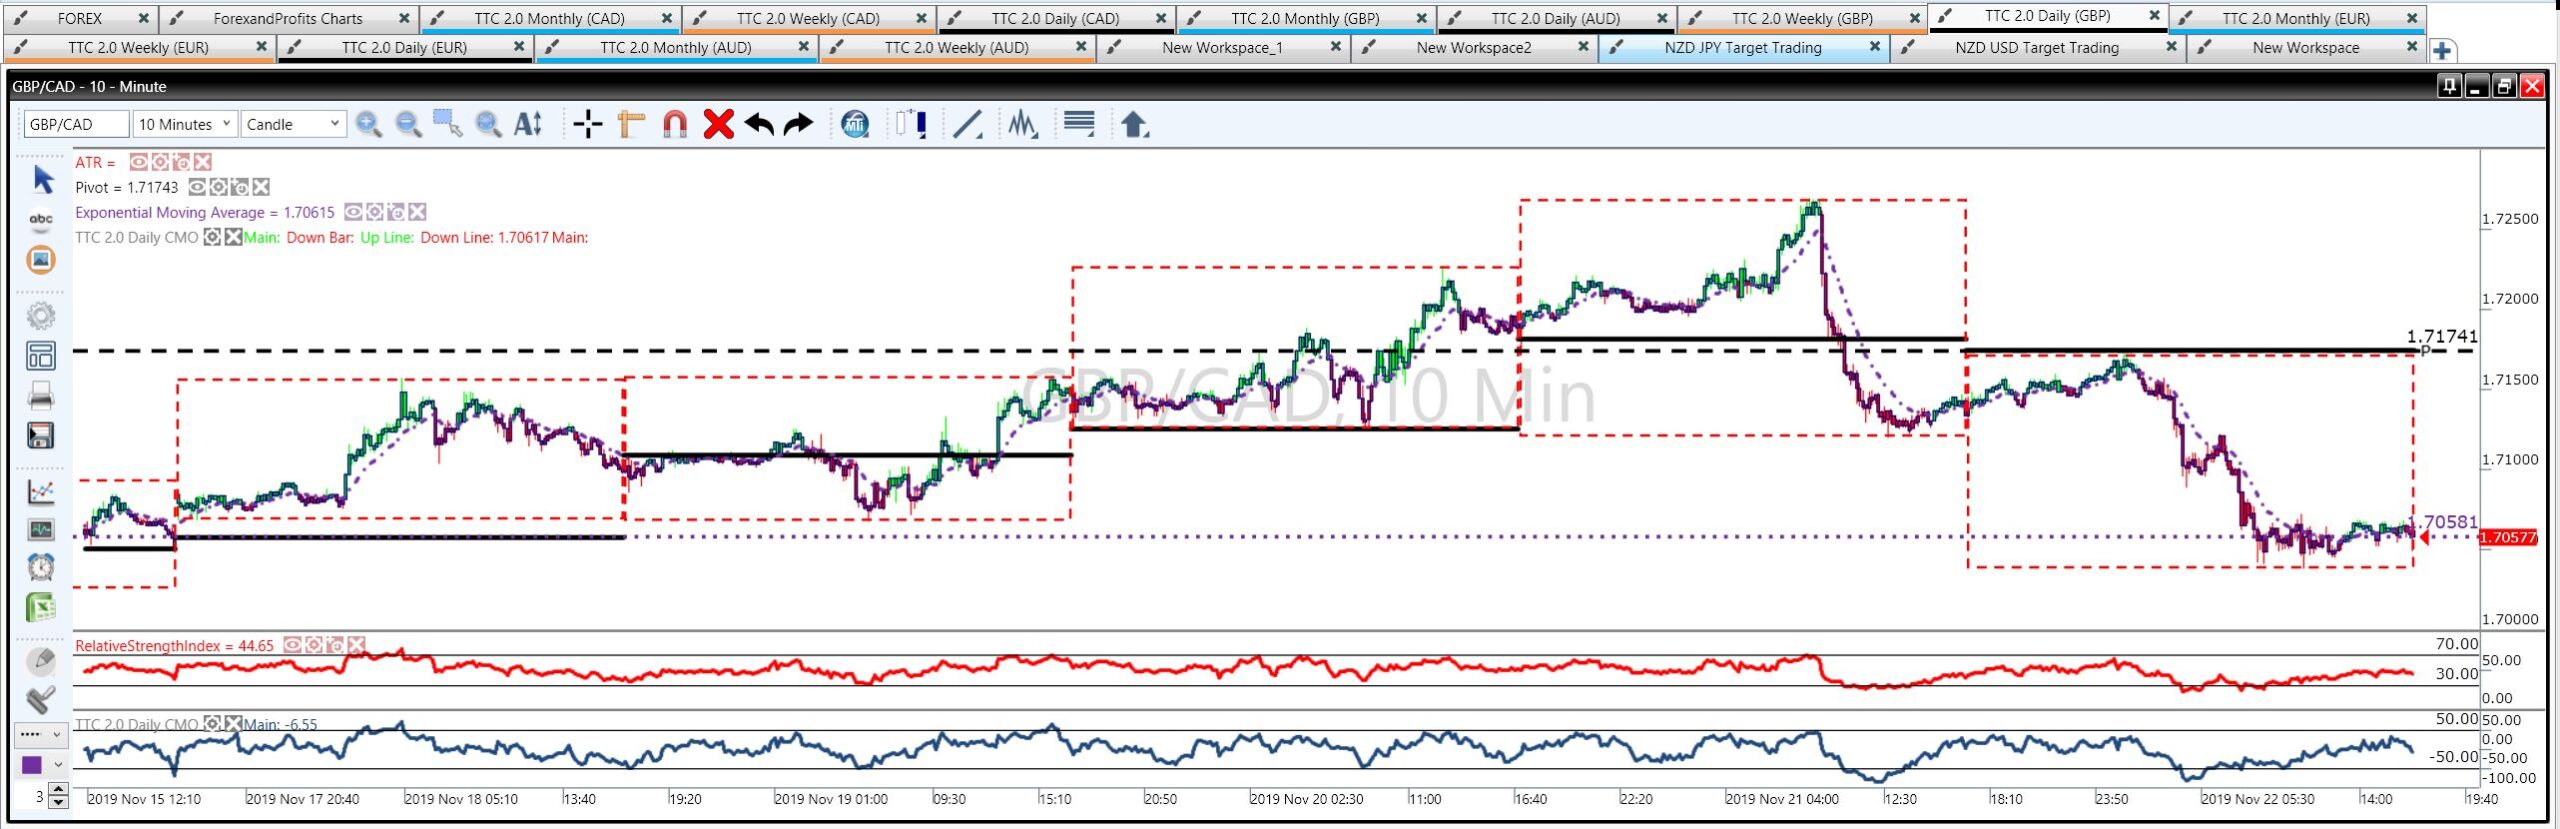
The GBP CAD has just narrowly missed hitting the target at 1.71741 and dipped down to hit an older target at 1.70581.
The RSI and CMO are just above the buy zone indicating there is further downside to go with this pair before it turns to go back up to the target at 1.71741.
Or a new target may form further down giving this pair momentum to drive down further before the RSI and CMO turn back up.
The simplest way to use pivot point levels in your forex trading is to use them just like your regular support and resistance levels.
Just like good ole support and resistance, price will test the levels repeatedly.
Source: Babypips.com
How I use pivot points in my daily trading
Here is my pivot points trading strategy:
This is a method where you put in your first trade at a very low lot size. As the currency goes toward the target, you add trades on, again in low lot sizes.
Throughout check your regular charts on this currency pair. Check your fibs, your trend lines, and the RSI on those charts.
The currency will take you on a roller coaster ride of up and down as it winds its way toward the target you have found…
It may go past that target entirely which will require you to find the next target and again recheck all your charts, your fibs, your trend lines, your candlestick formations.
Add on and compare with your favorite indicator, the ADX or the MacD, etc.
When the price approaches a pivot point—especially for the first time in each direction—it will have a tendency to reverse.
The pivot point bounce trading system is looking for reversals.Source: Thebalance.com
Best currency pairs for pivot point
I personally like to use pivot points for these pairs:
- EURUSD
- NZDUSD
- EURJPY
When that is being said, you can use pivot points on any forex pairs or trading instruments.
How to find strong pivot points?
Don’t forget to take into consideration any fundamentals that come up in your trading week.
Make sure to govern your stops. I love when I hear traders say, they set their trade and walk away.
Well maybe they are better than I am, maybe they know more than me, however, I keep an eye on my trades and how close they are getting on my phone app.
I don’t walk around the grocery store with my forex app on.
But I like to check it often, just to make sure no surprise is happening. You never know – any spike or fundamental that is going a lot further than what I anticipated, so I can either adjust or decide to let it take its course.
In short, this is basic support and resistance trading.
The more times a pivot level has touched the reverses, the stronger the level is. Pivoting means reaching a support or resistance level and then reversing.
Pivot points have the advantage of being a leading indicator, meaning traders can use the indicator to gauge potential turning points in the market ahead of time.
They can either act as trade entry targets themselves by using them as support or resistance, or as levels for stop-losses and/or take-profit levels.Source: Daytrading.com
How to use pivot points in trading?
The concept is very easy:
- If the price is nearing the upper resistance level, you could SELL the pair and place a stop above the resistance.
- If the price is nearing a support level, you could BUY and put your stop below the level.
Pivot point trading strategy
Pivot Point trading is a powerful strategy that can help you to be more profitable.
It’s essential to have a good strategy for your stop loss as much as to have an entry strategy.
If the price breaks above the central pivot point then the sentiment has shifted on the bullish side and it’s wise to get out of any short trades.
However, in order to accommodate any false breakouts, we also use a buffer of about 5-10 pips above the central pivot point for our SL.Source: Tradingstrategyguides.com
Check out this video
“Pivot Points Explained for Day and Swing Trading” by David Moadel.
Daily pivot points
Daily pivot points can be beneficial for swing trading. While 4-hour pivot points can be handy for intraday trading, longer-term pivot points can provide an idea of where key support and resistance levels should be.
You won’t want to miss out on this exciting new way to trade the markets! Swing traders everywhere are already using pivot points to make more profitable trades.
You can find all the daily pivot points updated here on Actionforex.
By placing the pivot points on your charts, you can see how traders appear to be giving these levels a lot of importance. This information could help you make better trading decisions in the future.
Pivot point breakout
Learn how to identify profitable swing trading breakouts from volatility contraction patterns!
In this swing trading video, forex trader Jack Cornellis will show you how to successfully identify the best profitable swing trading breakouts pivot points from volatility contraction patterns.
The example is for crypto, but you can use this strategy for all forex pairs as well.
Forex pivot point calculator
Calculate the pivot points. Then, take into account supply and demand, as well as recent trends in the market.
The support levels act like stops for traders who might want to buy or sell at those prices while resistance is where they will wait out any potential buyers until it becomes more favorable than just selling right away.
These individuals know that if something happens then there’s always someone willing (and able) to take advantage of an opportunity when given!
How to use the forex pivot point calculator:
It is easy to use the calculator above. To do the calculation yourself:
- Calculate the pivot points, support levels, and resistance levels for x number of days.
- Subtract the support pivot points from the actual low of the day (Low – S1, Low – S2, Low – S3).
- Subtract the resistance pivot points from the actual high of the day (High – R1, High – R2, High – R3).
Pivot points in trading – conclusion
I hope this article was helpful and you now understand why I’m always looking at pivot points in trading.
Basically, it is indeed one of the most helpful indicators out there.
Now I hope you want to include pivot points and target trading in your daily analysis.
No matter how much research we do about the most popular indicators, we need to focus on some fundamentals, like a powerful Forex strategy that actually works.
Recommended article: Successful Forex strategies that definitely will make your trading more profitable.
We would like to know if you use pivot points in your trading today?
What are your favorite forex indicators? Please share, like, and comment on our Forex and Profits Club.